Customer Analytics Bell Diagram – Competitive Advantage Analysis
RJ0500014_9
- Last Update 06/11/2025
- File Size 5.9MB
- # of Slides 2
- File Format PPTX
- Slide Ratio 16:9
- Color
Keywords
- #Content-Based Slides
- #Design-Based Slides
- #Market and Competitor Analysis
- #Graph
- #Market Analysis
- #Competitive Advantage
- #Line
- #Line Chart
- #16:9
- #bell curve diagram PowerPoint
- #data distribution slide template
- #customer analytics chart
- #market analysis graph
- #competitive advantage analysis
- #bell-shaped curve presentation
About the Product
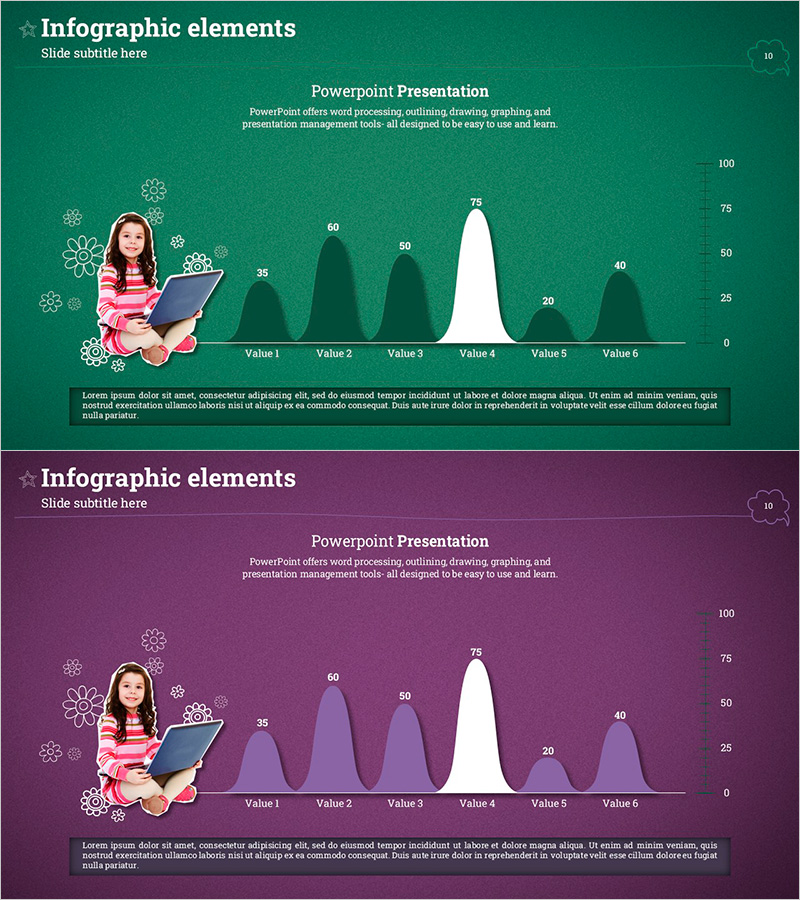
A bell curve diagram PowerPoint slide designed for customer analytics and competitive advantage visualization. This presentation template displays six data points in a bell-shaped distribution curve to communicate patterns and central tendencies intuitively. The slide features a dark green and white color scheme with a female character and icon elements in an infographic style, ready for immediate use in customer segmentation, market analysis, and competitive positioning presentations. The 2-slide set includes both green and purple tone versions in 16:9 widescreen PPTX format with full editing capability.
Usage Points
-
Main Usage
Visualizes customer data distribution patterns using a bell-shaped curve to reveal central tendency and variance at a glance. Effectively highlights competitive advantages in market analysis or illustrates target customer characteristics in segmentation strategies.
-
How to Use
Replace the six displayed values (35, 60, 50, 75, 20, 40) with your actual data. Customize the female character and icons to represent customer personas or market segments, and add analysis findings and insights to the text areas.
-
Recommended For
Ideal for marketing professionals, market analysts, sales strategy teams, and executive presentations. Suitable for customer satisfaction analysis, market share comparison, competitive positioning pitches, and product performance benchmarking where quantitative data requires distribution-based explanation.
-
Slide Structure
Two-slide set with each slide displaying six data points in a bell-shaped curve. Layout features a female character with gear icons on the left, the bell curve graph in the center, and a Y-axis scale (0–100) on the right. First slide uses dark green background; second slide uses purple background for color variation options.
Related Products
-

Architectural Illustration Templates and Line Charts – Visualizing Market and Competitive Advantage
#Market and Competitor Analysis #Graph #Market Analysis
-

Bell Charts for Various Topics – Market Competition Analysis
#Market and Competitor Analysis #Graph #Market Analysis
-

Segmented Bar Graph and Line Graph – Ideal for Market Analysis
#Market and Competitor Analysis #Graph #Market Analysis
-

Comparative Chart Analysis – Optimized for Market and Competitive Analysis
#Market and Competitor Analysis #Graph #Market Analysis
