Table Chart and Descriptive Text – Visualizing Sales Metrics
RJ0500014_18
- Last Update 06/10/2025
- File Size 6.1MB
- # of Slides 2
- File Format PPTX
- Slide Ratio 16:9
- Color
Keywords
About the Product
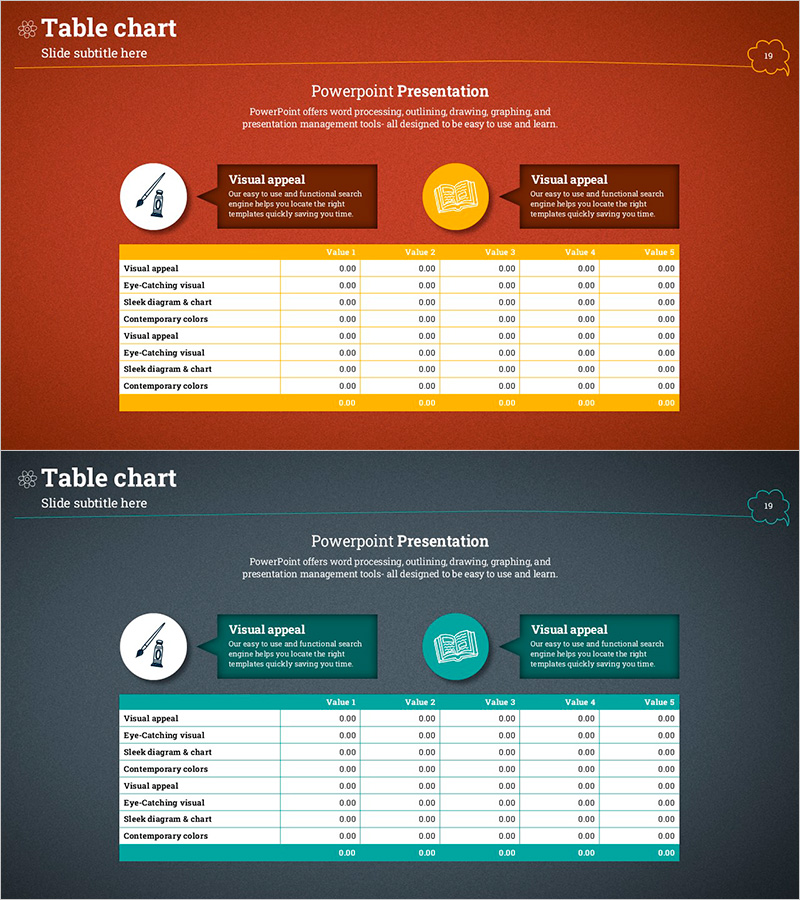
A two-slide PowerPoint presentation featuring a 5-column data table designed to visualize financial performance and sales metrics. Available in two color themes: warm orange and teal. Each slide includes icon graphics and descriptive text boxes at the top, with an 8-row by 5-column data table positioned below for clear numerical comparison. Ideal for quarterly performance analysis, departmental revenue tracking, and product-level sales reporting. Fully editable and ready to integrate into business reports, investor presentations, and executive briefings.
Usage Points
-
Main Usage
Present financial performance, sales metrics, and quarterly or monthly results in a structured table format for comparative analysis. Designed for executive reports, investor relations presentations, and business performance reviews where numerical data clarity is essential.
-
How to Use
Replace the icon and descriptive text at the top with your presentation topic. Update the table row labels and numerical values with your actual data. Select either the orange or teal color theme to match your corporate branding or presentation context.
-
Recommended For
Finance teams, executives, business analysts, and marketing professionals presenting quarterly results, departmental performance, product revenue, or regional sales figures. Suitable for investor pitches, shareholder meetings, board presentations, and internal management reviews.
-
Slide Structure
Two-slide set with consistent layout: top section contains icon graphic and two text boxes for context, bottom section features an 8-row by 5-column data table with yellow header row and white data cells. Clean visual hierarchy supports quick data comprehension.
Related Products
-

Colors Theme Presentation Template Table – Financial Planning and Performance
#Financial Plans and Performance #Diagram #Sales and Revenue
-

Effective Data Table Slide – Financial Planning and Performance
#Financial Plans and Performance #Diagram #Sales and Revenue
-

Sales and Profit Table – Statistical Financial Performance
#Financial Plans and Performance #Diagram #Sales and Revenue
-

Farm Key Financial Indicators Table Chart – Intuitive Presentation of Financial Performance
#Financial Plans and Performance #Diagram #Sales and Revenue
