Customer Analysis Double Bar Graph – Effective Market Analysis
RJ0500014_13
- Last Update 06/10/2025
- File Size 6.5MB
- # of Slides 2
- File Format PPTX
- Slide Ratio 16:9
- Color
Keywords
About the Product
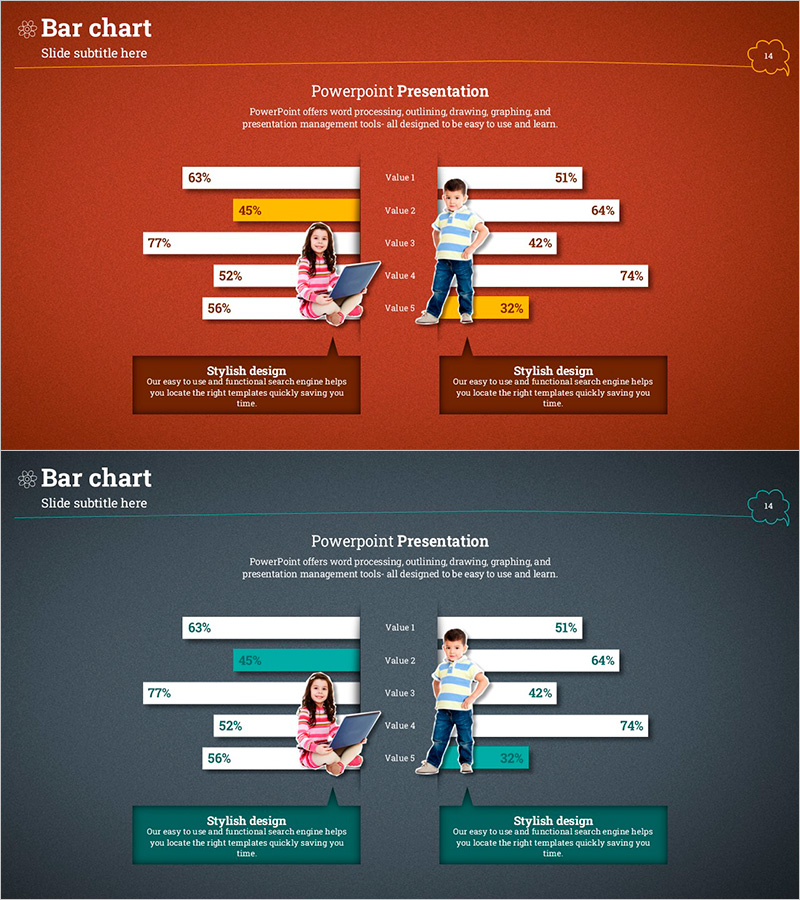
A dual-axis bar chart PowerPoint slide designed for customer analysis and market comparison. This presentation template visualizes contrasting data side-by-side, enabling clear comparison between two groups across five metrics. The design combines a warm rust background with white and yellow bar segments, creating distinct visual separation between data series. Character illustrations enhance the presentation context and engagement. The 16:9 widescreen format supports immediate use in customer segmentation analysis, competitive benchmarking, market research presentations, and performance comparison reports.
Usage Points
-
Main Usage
Parallel comparison of performance metrics between two groups or entities. Ideal for displaying customer satisfaction by segment, competitive advantages versus rivals, market research findings, and side-by-side performance analysis where numerical differences must be immediately apparent.
-
How to Use
Assign the left bars to your baseline group (e.g., your company) and right bars to the comparison target (e.g., competitor). Input numerical values for five metrics, adjust color coding to distinguish data series, and reposition character illustrations to match your presentation topic.
-
Recommended For
Marketing professionals presenting market analysis, sales teams conducting customer comparisons, executives reviewing competitive positioning, and consultants delivering benchmarking studies. Best suited for data-driven business presentations requiring quantitative decision-making support.
-
Slide Structure
Two-slide set with rust background version featuring five dual-bar pairs (white left bars, yellow right bars) with percentage labels and character illustrations on the right. Second slide uses dark background with turquoise accent bars. Both slides include descriptive text areas at the bottom for context and insights.
Related Products
-

Horizontal Bar Graph Analysis by Gender – Market Insights
#Market and Competitor Analysis #Graph #Customer Analysis
-

User Gender Ratio Analysis Graph – Customer Insights
#Market and Competitor Analysis #Graph #Customer Analysis
-

Two-way Chart of Male and Female Surveys – Gender Comparison Visualization
#Market and Competitor Analysis #Graph #Customer Analysis
-

Statistics on People's Physical Fitness in Bar Chart – Insights Aimed at Competitive Advantage
#Market and Competitor Analysis #Graph #Other
