Performance and System Flow Slide – Visualizing Business Strategy
RJ0500014_15
- Last Update 06/10/2025
- File Size 6.1MB
- # of Slides 2
- File Format PPTX
- Slide Ratio 16:9
- Color
Keywords
About the Product
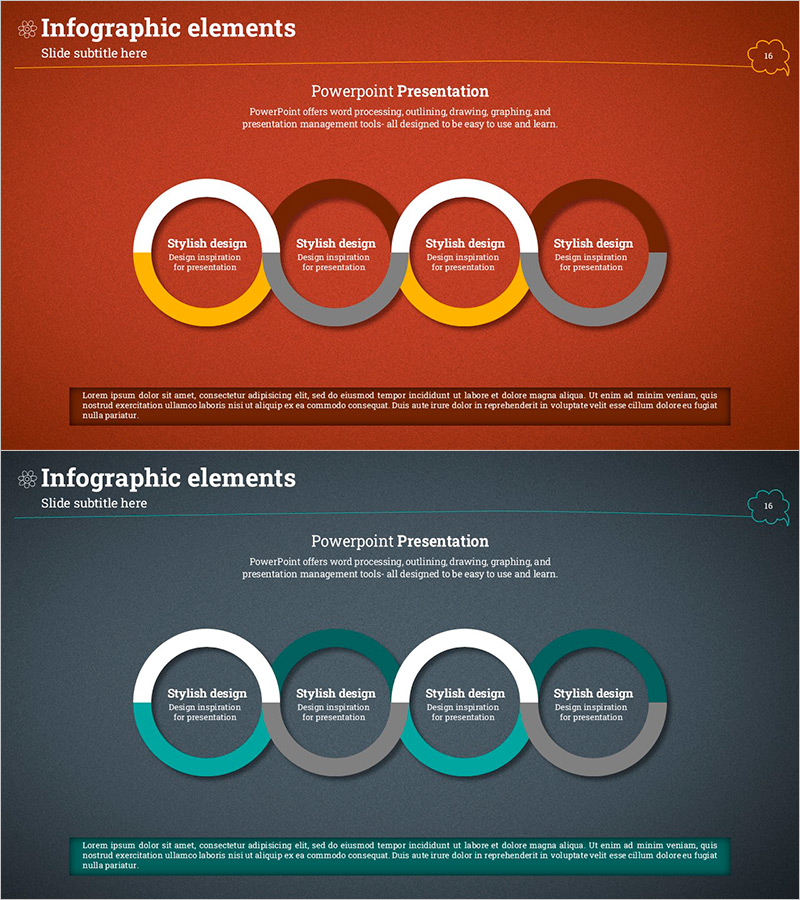
A PowerPoint slide that visualizes business performance and systematic flow through a 4-node circular diagram structure. Alternating white, yellow, dark red, and gray donut-shaped nodes emphasize process connectivity and cyclical progression. Composed of 2 slides in 16:9 widescreen format, each node provides editable text areas for titles and descriptions. Ideal for business plans, management reports, and strategy presentations where you need to illustrate performance achievement cycles, operational workflows, or continuous improvement loops in your PPT slides.
Usage Points
-
Main Usage
Conveys phased business performance and iterative processes through a circular structure, helping audiences understand continuous improvement and cyclical growth models intuitively. The balanced 4-node layout emphasizes equal importance of each stage, while the arrow-free donut design creates a natural flow progression.
-
How to Use
Apply to executive performance reports (business achievement sections), strategy presentations (annual goal cycles), quality management process explanations, and marketing campaign iteration timelines. Edit node text to specify stages (Plan→Execute→Evaluate→Improve), and adjust background colors to match brand guidelines.
-
Recommended For
Recommended for executives developing business strategy, team leads reporting project outcomes, operations managers explaining workflows, and organizational development professionals emphasizing continuous improvement culture. Particularly effective in annual business plans, quarterly performance reports, and strategic workshop materials.
-
Slide Structure
2-slide set with each slide featuring 4 donut-shaped nodes arranged horizontally in a circular diagram. First slide uses red-tone palette (white, yellow, dark red, gray); second slide uses teal-tone palette (white, teal, gray, charcoal). Each node contains a centered text input area and is optimized for 16:9 widescreen format.
Related Products
-

Modern Business Background and Necessity – Slide Illustrating Business Strategy Flow
#Business Vision and Strategy #Business Strategy #Diagram
-

Business Direction Illustrated with Camping Infographic
#Business Strategy #Diagram #Step-by-Step Schedule Plan
-

Journey to a Goal Slide – Emphasizing Business Strategy
#Business Vision and Strategy #Business Strategy #Diagram
-

Takeoff Strategy for Global Expansion – Business Vision and Initiative
#Business Vision and Strategy #Business Strategy #Diagram
