Learning Icon Cluster Diagram – Visualizing Company History
RJ0500014_5
- Last Update 06/11/2025
- File Size 5.7MB
- # of Slides 2
- File Format PPTX
- Slide Ratio 16:9
- Color
Keywords
About the Product
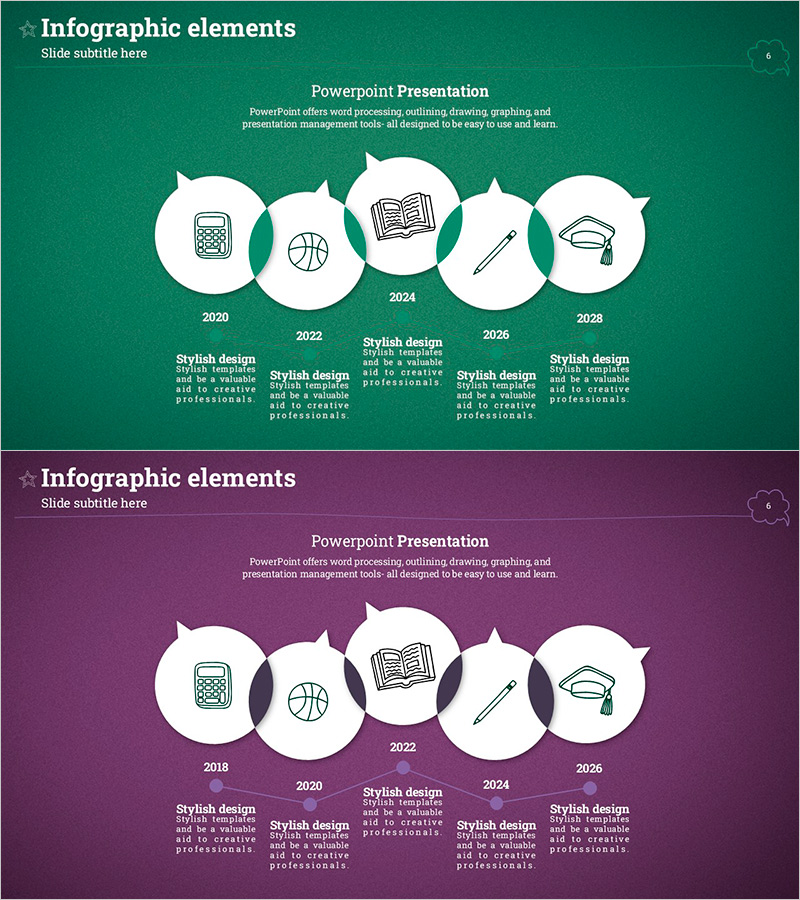
A five-node cluster diagram PowerPoint slide designed to visually represent your company's growth journey and learning milestones. The design features a central message surrounded by five white circular nodes, each containing distinct icons: calculator, basketball, book, pen, and graduation cap. These symbols represent different stages of development or learning phases. Available in two color schemes—deep teal and purple backgrounds—the high-contrast white nodes and icons ensure clear visibility. This 2-slide template is fully editable and ready to integrate into company presentations, business reports, educational materials, and organizational development decks.
Usage Points
-
Main Usage
Effectively communicate your organization's evolution, learning progression, or developmental milestones using a centralized cluster structure. The symbolic icons at each node make complex narratives intuitive and memorable for your audience.
-
How to Use
Perfect for company history sections in corporate presentations, growth stage explanations in business reports, and learning pathway illustrations in educational programs. Simply edit the text and icons in each node to match your content, and select your preferred background color to align with your brand identity.
-
Recommended For
Corporate executives, marketing professionals, educators, management consultants, and project managers who need to present organizational evolution or structured learning programs. Ideal for situations requiring visual representation of company milestones, career development paths, or sequential business processes.
-
Slide Structure
Five white circular nodes arranged around a central focal point, each containing a distinct icon (calculator, basketball, book, pen, graduation cap). Below each node, space is provided for year labels and descriptive text to establish chronological or sequential information flow. Two background color options (deep teal and purple) are included for design flexibility.
Related Products
-

Historical History Diagram by Year – Business Strategy and Vision
#Company Introduction #Business Strategy #Diagram
-

History of AI Robot Development – Journey of Technological Innovation
#Company Introduction #Diagram #History
-

Diagram of Delivery Progress by Year – Visualization of Progress Over Time
#Company Introduction #Product/Service Introduction #Diagram
-

Company History Linear Diagram – A Clear View of Business Progress
#Company Introduction #Diagram #History
