Finance Theme PowerPoint Template Wide – Professional and Elegant Design
J0300022
- Last Update 01/06/2025
- File Size 11.7MB
- # of Slides 21
- File Format PPTX
- Slide Ratio 16:9
- Color
Slide Preview


Keywords
About the Product
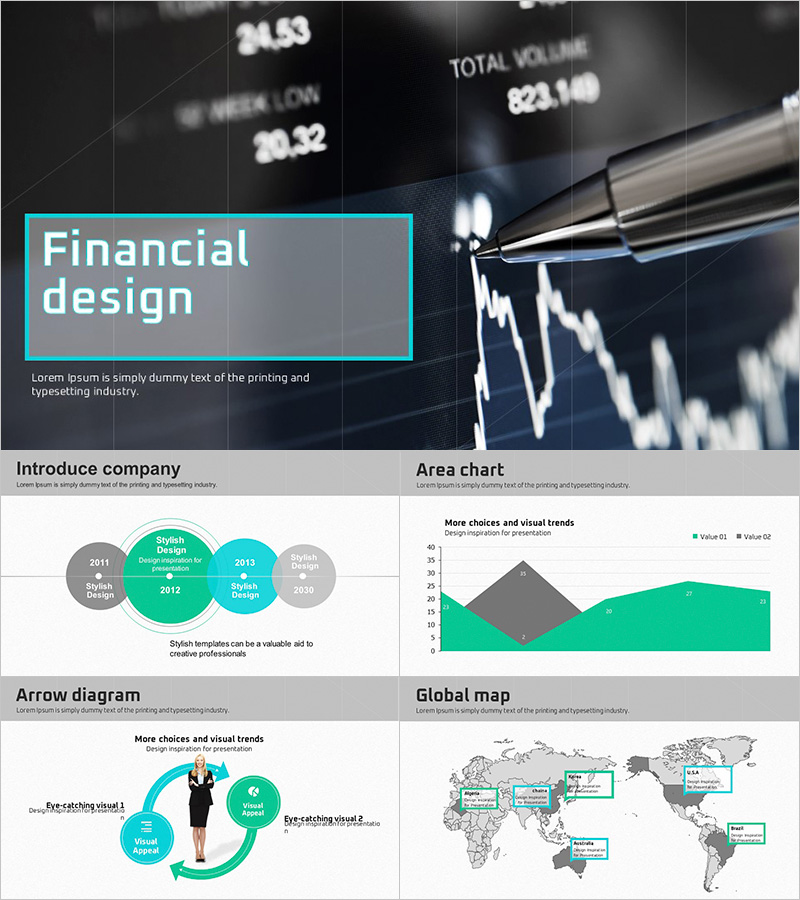
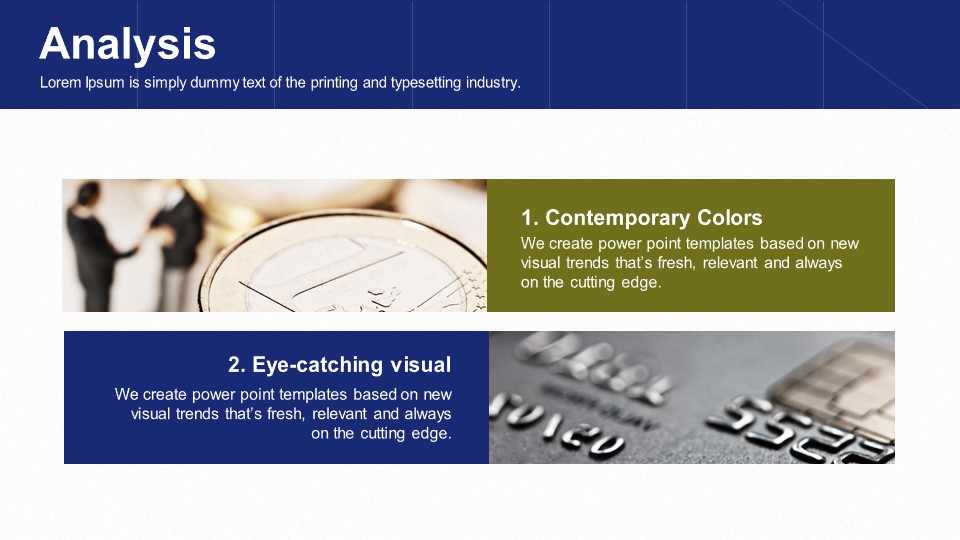
A professional finance and business PowerPoint template featuring a dark navy blue background combined with real stock chart photography. This 21-slide presentation deck covers everything from a cinematic title slide to timeline diagrams, area charts, global maps, pictogram infographics, and Venn diagrams — giving you a complete toolkit for financial presentations. The two-column grid layout pairs navy header bars with olive gold accent colors, allowing you to balance data visuals and text content with clarity. Ideal for investment reports, financial analysis decks, and corporate service introductions where credibility and data precision matter. The PPTX format is fully editable, so you can replace company names, figures, and text immediately after download. Recommended for finance professionals, IR managers, business consultants, and executives who need a polished, data-driven slide deck.
Usage Points
-
Main Usage
Designed for investment reports, financial analysis presentations, corporate finance introductions, and business planning decks where a data-driven, trustworthy visual tone is essential.
-
How to Use
Download the PPTX file and replace placeholder text, figures, and company names to customize immediately. Use the area chart and pictogram infographic slides to visualize financial data, market share, or KPI comparisons with your actual numbers.
-
Recommended For
Best suited for finance professionals, investment analysts, IR managers, business consultants, and executives who regularly present financial results, market analysis, or strategic plans to stakeholders.
-
Slide Structure
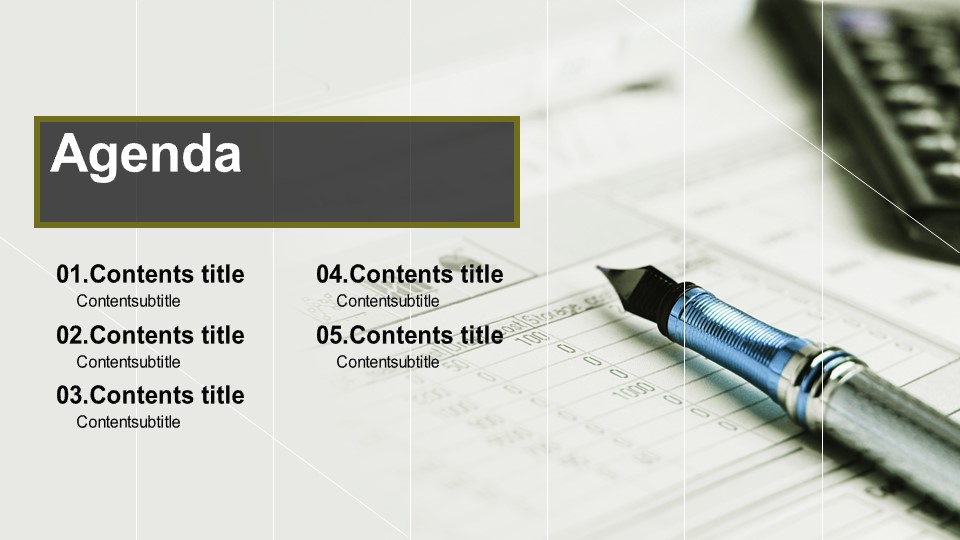
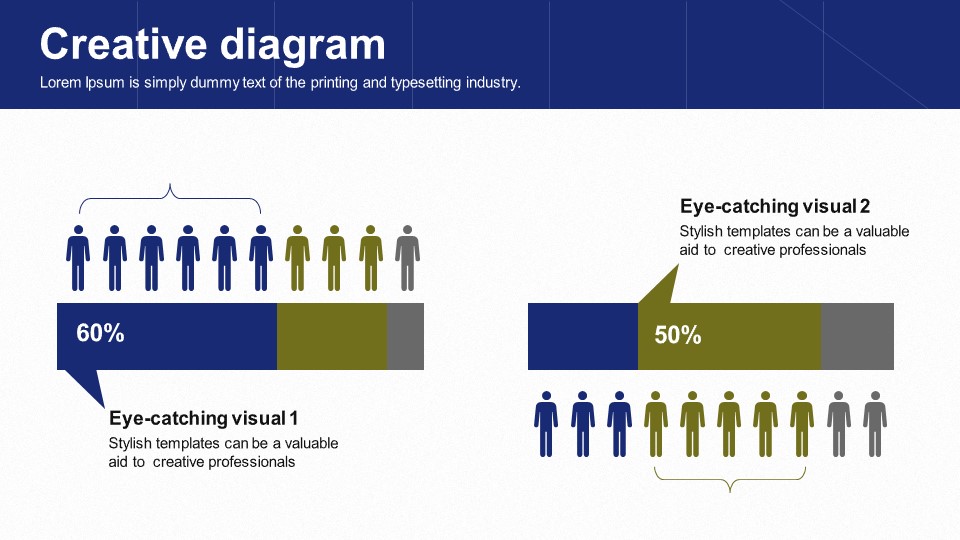
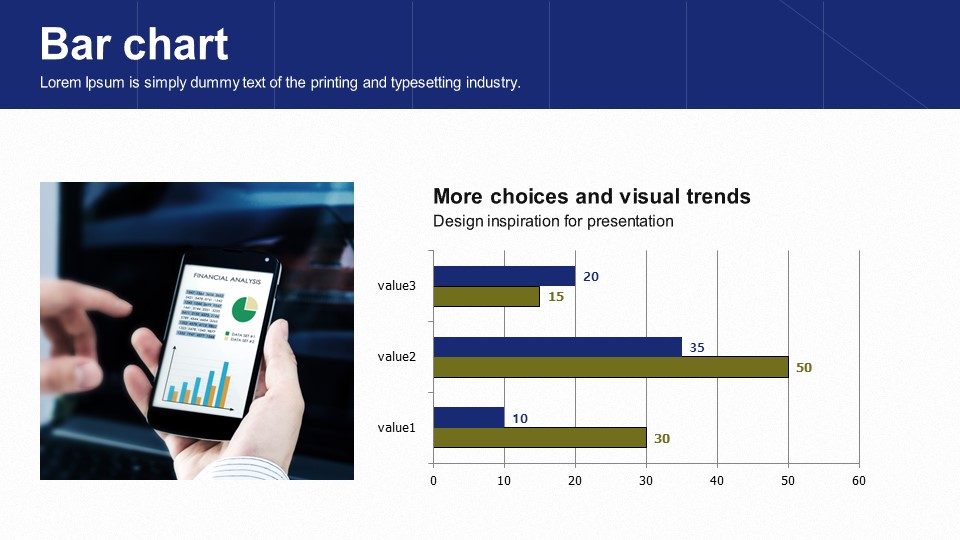
Includes two title slide variants (dark and light), a circular timeline diagram (2011–2030), a two-color area chart, a circular arrow diagram with photo insert, a global map slide, a pictogram ratio infographic (60%/50%), and a three-circle Venn diagram — 21 slides total.
Related Products
-

Office Supplies Presentation Template – Catch Attention with Wide Design
#Business
-

Opinion PPT Wide – Stylish Design for Effective Presentations
#Business
-

Partnership PowerPoint Template – Ideal for Business Presentations
#Business
-

Business Partnership PowerPoint Template – Build Trust with Elegant Design
#Business
