Table of Key Financial Indicators to Highlight
RJ0300022_8
- Last Update 04/23/2025
- File Size 2.4MB
- # of Slides 2
- File Format PPTX
- Slide Ratio 16:9
- Color
Keywords
- #Content-Based Slides
- #Design-Based Slides
- #Financial Plans and Performance
- #Diagram
- #Income Statement
- #Key Financial Indicators
- #Table
- #Standard Table
- #16:9
- #financial metrics table PowerPoint
- #financial comparison slide template
- #performance indicators PPT
- #financial planning table
- #data table slide design
About the Product
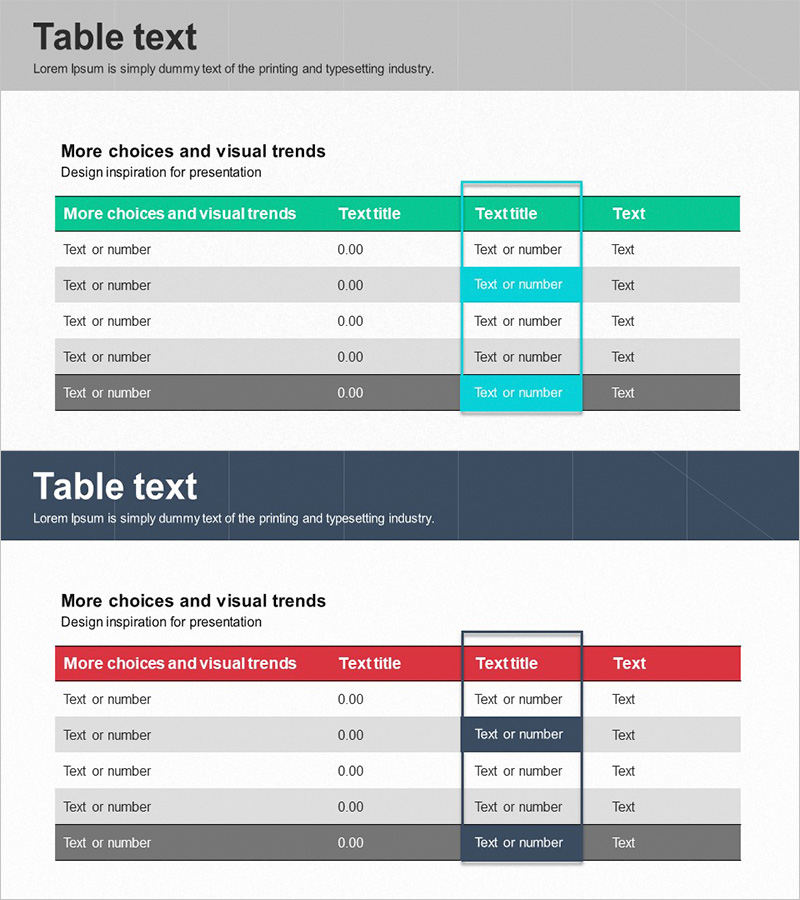
A table-based PowerPoint slide designed to clearly compare and analyze financial performance metrics. Featuring two layout variations with turquoise and red headers and gray row backgrounds to emphasize key indicators. Ideal for income statements, financial planning presentations, and performance reports where numerical data needs to be organized and compared at a glance. Each cell accommodates text or numeric input, optimized for 16:9 widescreen format.
Usage Points
-
Main Usage
Visualize financial performance indicators, income statement line items, and quarterly or annual numerical comparisons in table format while directing audience attention to critical figures through color emphasis.
-
How to Use
Two slide layouts provided: first with turquoise header, second with red header. Input financial item names and values into each cell, and adjust row background colors as needed to control emphasis levels and visual hierarchy.
-
Recommended For
Finance professionals, CFOs, investor relations managers, quarterly earnings presenters, and business plan authors who need to communicate financial status, budget allocation, and profitability analysis effectively to stakeholders.
-
Slide Structure
Two 4-column table variations. Header row (turquoise or red) with four column titles: Item Name, Metric, Text, Text. Five data rows with alternating white and gray backgrounds. All cells support text and numeric input with adjustable row height and column width.
Related Products
-

Insight Summary Table – Visualizing Financial Plans and Performance
#Financial Plans and Performance #Diagram #Income Statement
-

Premium Management Presentation Table – Efficient Financial Planning
#Financial Plans and Performance #Diagram #Income Statement
-

Paper Theme Key Financial Indicators Slide
#Financial Plans and Performance #Diagram #Income Statement
-

Income Statement Table – Clearly Presenting Financial Performance
#Financial Plans and Performance #Diagram #Income Statement
