Mobile App Usage Analysis Graph – Insights for Competitor Analysis
RJ0300022_13
- Last Update 04/23/2025
- File Size 3.7MB
- # of Slides 2
- File Format PPTX
- Slide Ratio 16:9
- Color
Keywords
- #Content-Based Slides
- #Design-Based Slides
- #Market and Competitor Analysis
- #Graph
- #Competitor Analysis
- #Market Analysis
- #Horizontal Bar
- #Grouped Horizontal Bar
- #16:9
- #horizontal bar chart PowerPoint
- #grouped chart template
- #competitor analysis slide
- #mobile app analytics graph
- #data comparison chart
- #how to create grouped bar chart in PowerPoint
About the Product
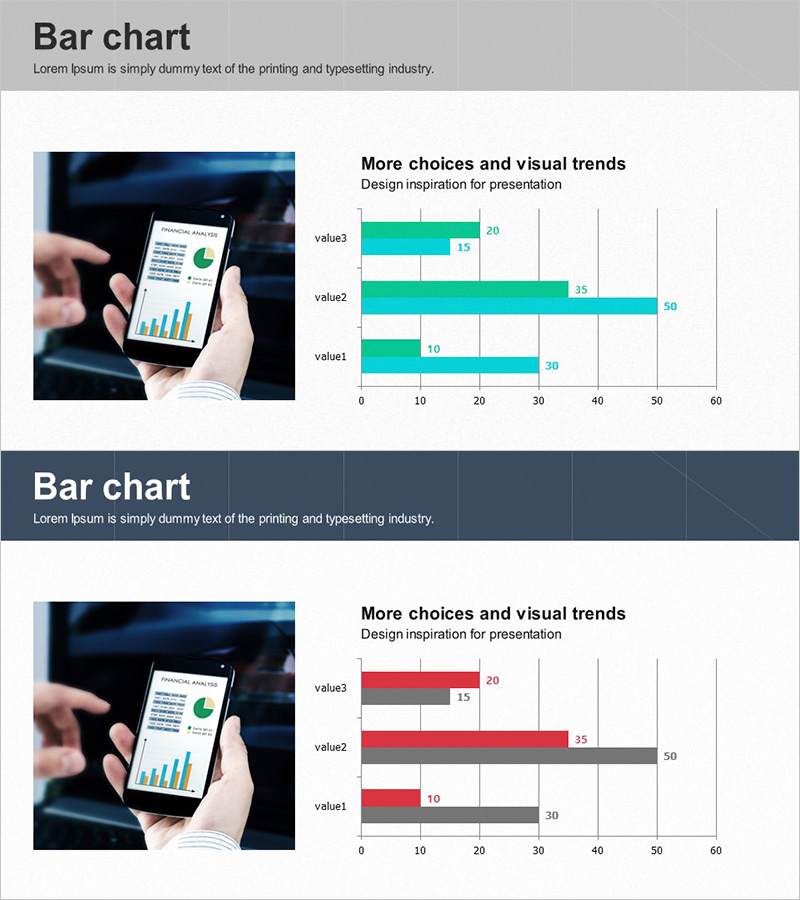
A horizontal grouped bar chart PowerPoint slide designed for mobile app usage analysis and competitive benchmarking. The slide features teal and gray data series arranged side-by-side to compare performance metrics across three competitors (value1, value2, value3). This visualization enables clear identification of market positioning and competitive advantages. The 16:9 format includes 2 fully editable slides suitable for marketing reports, business analysis presentations, and market research documents.
Usage Points
-
Main Usage
Quantitatively compare competitor performance metrics and analyze market positioning. The grouped bar format simultaneously displays two or more indicators (such as app downloads, user engagement, or revenue) for each competitor, clearly revealing relative strengths and weaknesses.
-
How to Use
Replace the placeholder labels (value1, value2, value3) with actual competitor names and input your data values. The bar lengths automatically scale to reflect the data, enabling instant visual comparison across all metrics and competitors.
-
Recommended For
Marketing managers, strategy teams, and executives presenting market analysis findings. Ideal for investor presentations, business planning meetings, quarterly performance reviews, and new business proposals. Particularly effective for mobile app, SaaS, and digital service industries.
-
Slide Structure
Two-slide set featuring grouped bar charts with 3 items and 2 data series each. The first slide uses teal bars, while the second combines teal and gray series. Horizontal bar orientation optimizes item-to-item comparison and accommodates longer category labels.
Related Products
-

Blue Orange Bundle Bar Graph - Insights for Market Analysis
#Market and Competitor Analysis #Graph #Competitor Analysis
-

Competitor Website Analysis Graph – Market and Competitor Analysis
#Market and Competitor Analysis #Graph #Competitor Analysis
-

Horizontal Bar Graph for Competitor Analysis – Effective Data Visualization
#Market and Competitor Analysis #Graph #Competitor Analysis
-

Cybersecurity Business Market Analysis Graph
#Market and Competitor Analysis #Graph #Competitor Analysis
