User Analysis Graph Visualization – Market and Customer Insights
RJ0300022_10
- Last Update 04/23/2025
- File Size 2.4MB
- # of Slides 2
- File Format PPTX
- Slide Ratio 16:9
- Color
Keywords
About the Product
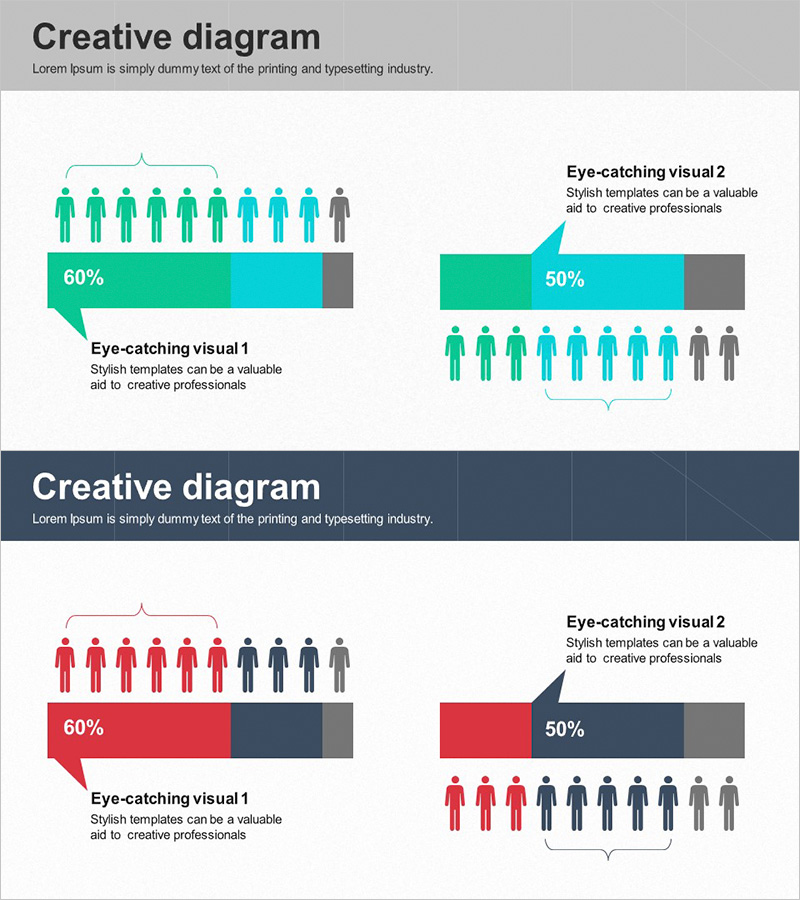
A 2-slide PowerPoint presentation for visualizing market analysis and customer insights with comparative data. Features turquoise and red-toned human silhouette icons paired with percentage-based bar charts to display user distribution, customer segments, and market share at a glance. The symmetric layout with left-aligned icon groups and right-aligned arrow-shaped ratio charts creates a balanced visual hierarchy ideal for analysis sections in business presentations. Delivered in 16:9 widescreen PPTX format compatible with all presentation environments.
Usage Points
-
Main Usage
Present quantitative market research and customer analysis results through visual representation to support data-driven decision-making. Optimized for comparing user distribution, customer segments, and market share ratios with clear visual hierarchy.
-
How to Use
Input primary user groups and percentages (e.g., 60%) on the left slide, then add comparative data (e.g., 50%) on the right slide. Use silhouette icon count and color differentiation to intuitively represent category proportions and segment emphasis.
-
Recommended For
Ideal for marketing plans, business reports, investor presentations, and market analysis briefings. Suitable for executives, analysts, and marketing professionals presenting customer segmentation, target market analysis, and competitive comparisons requiring data-backed insights.
-
Slide Structure
Two-slide layout with title area at top, central human silhouette icon group (10 icons), left-side percentage arrow chart with text input area, and right-side additional ratio display. Uses turquoise, red, and gray color scheme to clearly distinguish data layers and comparison categories.
Related Products
-

Athlete Competency Chart for Standardized Customer Analysis – Strengthening Competitiveness
#Company Introduction #Market and Competitor Analysis #Graph
-

Work Performance Analysis Graph – Visually Representing Employee Performance
#Market and Competitor Analysis #Graph #Other
-

Gender Comparative Analysis Detailed Graph – Market and Customer Insights
#Market and Competitor Analysis #Graph #Other
-

Orange Hexagon Presentation Template Segmented Vertical Bar Graph – Market and Competitive Analysis
#Market and Competitor Analysis #Graph #Other
