History Overlay Diagram – Company Introduction Slide
RJ0300022_5
- Last Update 04/23/2025
- File Size 2.4MB
- # of Slides 2
- File Format PPTX
- Slide Ratio 16:9
- Color
Keywords
About the Product
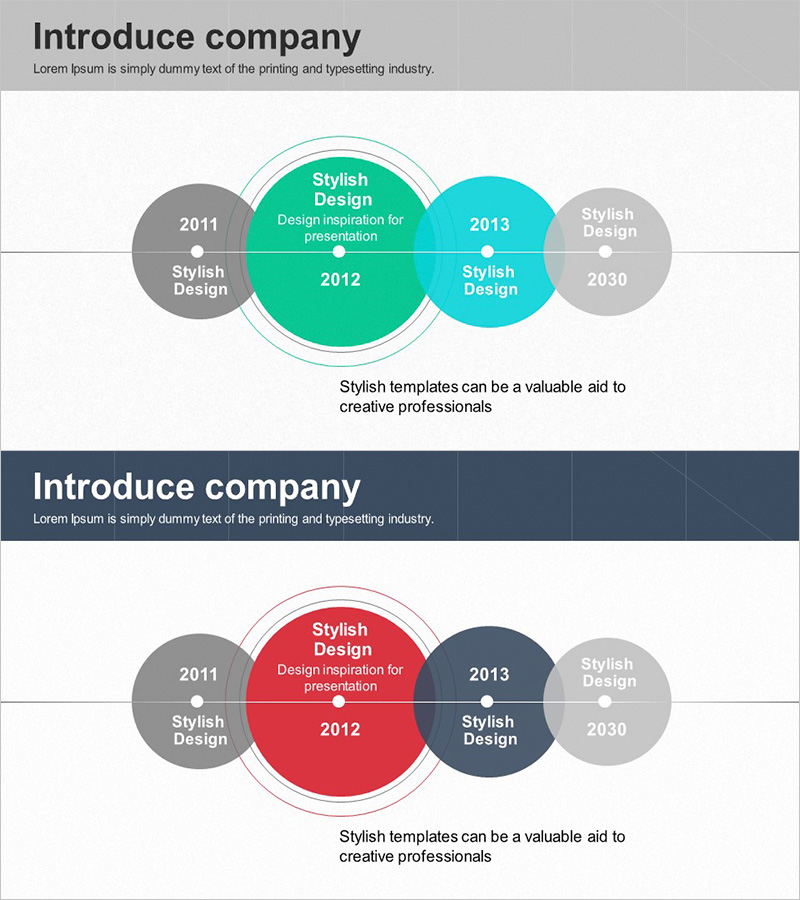
A PowerPoint slide featuring an overlay connection diagram designed to visualize company milestones and historical development. The layout centers on a large circular node with four connected nodes positioned on both left and right sides, effectively representing temporal progression and interconnected relationships. Turquoise and gray color contrast distinguishes importance levels, while connecting lines and dots clarify relationships between each period. Ideal for company introduction presentations to communicate corporate growth trajectories, key events, and strategic turning points. Delivered in 16:9 ratio PPTX format for immediate editing and customization.
Usage Points
-
Main Usage
Optimized for visualizing major company milestones, growth stages, and strategic turning points along a temporal axis. The hierarchical structure between central and peripheral nodes enables simultaneous representation of core periods and related events, enhancing audience comprehension.
-
How to Use
Deploy in company introduction presentations within the corporate overview or company history section. Edit node text and years to match actual company data and customize accordingly. The radial structure from center to periphery enables step-by-step narrative delivery during presentations.
-
Recommended For
Suitable for executive presentations, marketing team pitches, and investor-focused company introductions. Effective for explaining startup growth trajectories, corporate diversification, merger and acquisition history, and business expansion. Applicable to annual reports and corporate promotional materials.
-
Slide Structure
Central large circular node (2012 baseline) connected to two nodes on each side via connecting lines. Each node contains year labels and descriptive text. Color-coded with turquoise (center and right) and gray (left and right endpoints) for visual distinction. Two-slide set offering varied color combinations.
Related Products
-

Company History Linear Diagram – A Clear View of Business Progress
#Company Introduction #Diagram #History
-

Historical History Diagram by Year – Business Strategy and Vision
#Company Introduction #Business Strategy #Diagram
-

Scientific History Connection Diagram – Visualizing the Flow of Information
#Company Introduction #Diagram #History
-

Simple Theme Business History Diagram – Clear Timeline Representation
#Company Introduction #Diagram #History
