Business Area Connection Diagram – Exploring Business Domains
RJ0300022_16
- Last Update 04/23/2025
- File Size 2.5MB
- # of Slides 2
- File Format PPTX
- Slide Ratio 16:9
- Color
Keywords
- #Content-Based Slides
- #Design-Based Slides
- #Company Introduction
- #Business Introduction
- #Diagram
- #Business Areas
- #Business Areas
- #Cluster
- #Spread
- #Chain Diagram
- #Decentralized Diagram
- #16:9
- #cluster diagram PowerPoint
- #connection diagram slide template
- #4-node diagram
- #business area network PowerPoint
- #relationship diagram PPT slide
About the Product
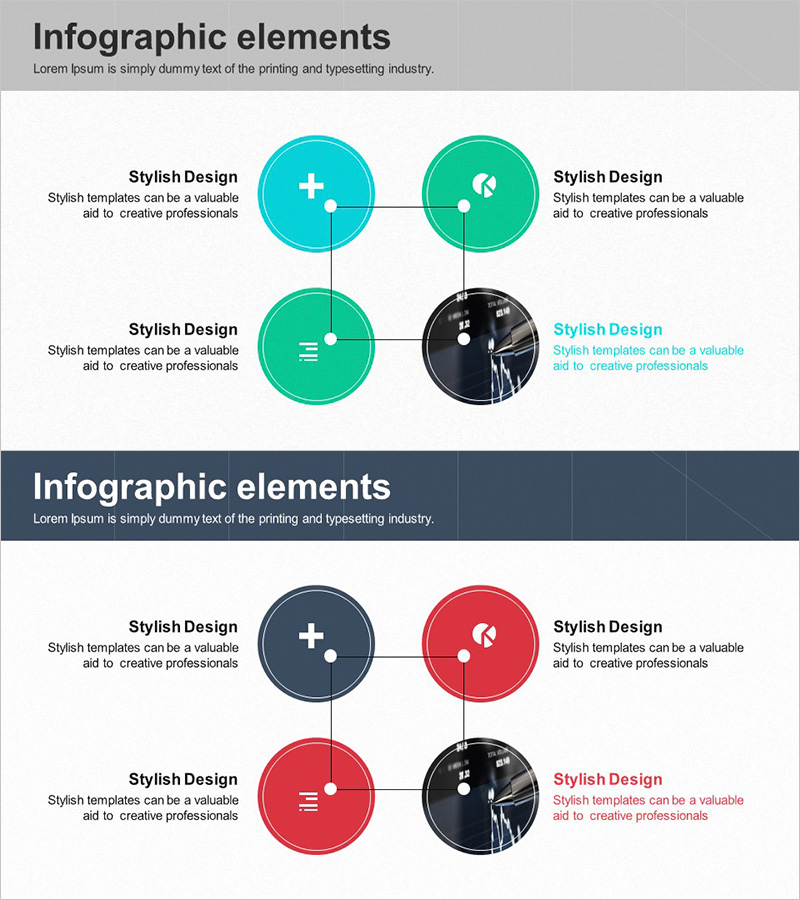
A cluster diagram PowerPoint slide featuring four circular nodes connected through a central intersection point. The design uses cyan, green, and dark navy color combinations to distinguish each node, creating a clear visual representation of business domain relationships. Includes two slide layouts—one with a light background and one with a dark background—allowing you to choose based on your presentation environment. This PowerPoint slide is ready to use for business field exploration, inter-organizational connections, partnership explanations, and various corporate presentations.
Usage Points
-
Main Usage
Visually represents interconnections and relationship structures between business domains. The four nodes connected through a central hub clearly communicate organizational collaboration, business synergies, and network structures.
-
How to Use
Enter business domain names, department titles, or partner names in each node, and place your core concept at the central intersection. Use the light background version for daytime presentations and the dark version for evening or premium-atmosphere presentations. All node colors and text are fully editable.
-
Recommended For
Ideal for executives, business development teams, strategic planning departments, and marketing teams presenting business portfolio overviews, organizational restructuring, partner networks, and new business area exploration. Effective for consulting reports, investor pitch decks, and strategic meeting materials.
-
Slide Structure
Two-slide layout. Each slide features four circular nodes (cyan, green, dark navy, and dark navy tones) arranged in a 2×2 grid connected through a central intersection point. Text areas beside each node allow for descriptive content. Optimized for 16:9 widescreen format with full editing capability.
Related Products
-

Main Business Areas Triangle Diagram
#Company Introduction #Business Introduction #Diagram
-

Company Stock Analysis Diagram – Stylish Design for Presentations
#Company Introduction #Business Introduction #Diagram
-

Core Business Area Diagram – Segmentation and Expansion
#Company Introduction #Business Introduction #Diagram
-

Internet of Things Service Area Diagram – Business Introduction and Visualization
#Company Introduction #Business Introduction #Diagram
