Business Process Diagram – Circular Workflow
RJ0300022_15
- Last Update 04/23/2025
- File Size 2.5MB
- # of Slides 2
- File Format PPTX
- Slide Ratio 16:9
- Color
Keywords
About the Product
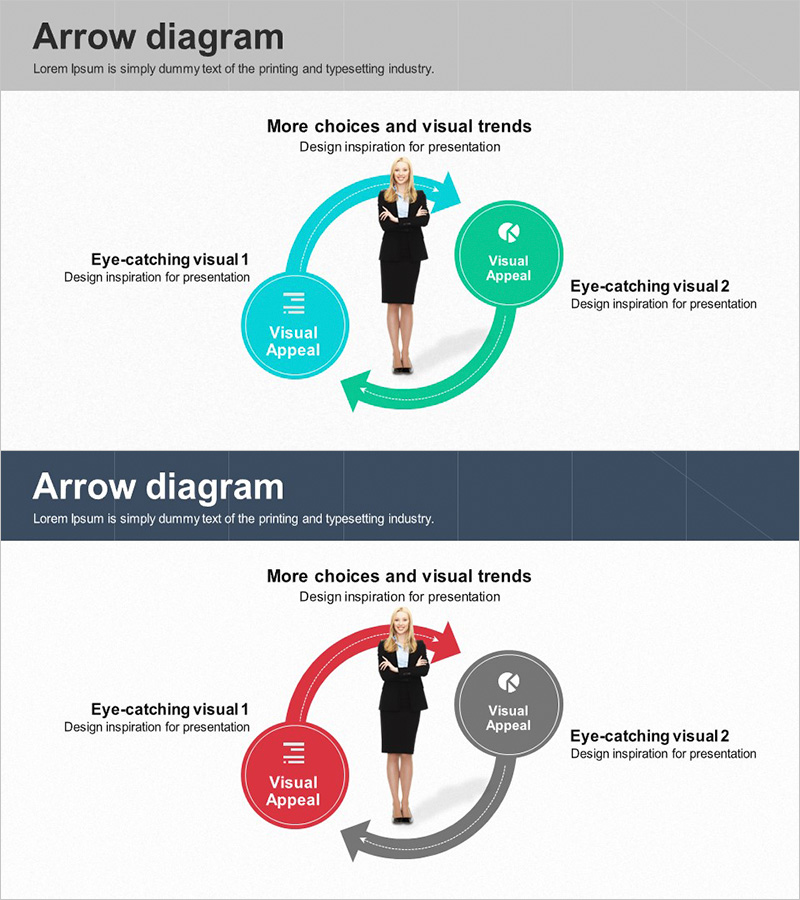
A PowerPoint slide template featuring a 3-step circular arrow diagram for visualizing business process flows. The design centers on a professional figure image with two circular nodes positioned on the left and right, connected by curved arrow paths that emphasize cyclical movement and continuous improvement. The first slide uses a vibrant cyan and green color scheme, while the second slide provides a red and gray variant, allowing you to match your presentation theme. Each node accommodates text and icons for labeling process stages, outcomes, or feedback loops. Delivered in 16:9 widescreen PPTX format for immediate editing and customization.
Usage Points
-
Main Usage
Illustrates cyclical business processes, iterative workflows, and continuous improvement initiatives. Ideal for explaining operational procedures, project management cycles, quality improvement programs, and customer experience enhancement strategies that follow a repeating pattern.
-
How to Use
Place your core concept or key stakeholder in the central figure area. Input process stages, activities, or outcomes in the left and right circular nodes. Use the arrow direction to emphasize the cyclical flow, and modify colors to distinguish between different processes or departments.
-
Recommended For
Effective for operational planning, process improvement, quality management, and customer service flow presentations. Suitable for business reports, strategic planning sessions, training seminars, and consulting proposals where iterative or cyclical structures need clear visualization.
-
Slide Structure
Two-slide set with identical layouts in different color schemes. Each slide features a central professional figure image flanked by two circular nodes connected by curved arrows forming a 3-step cycle. First slide: cyan and green palette. Second slide: red and gray palette for alternative theme matching.
Related Products
-

Visual Trend Analysis Using Circle Diagram – Capturing Visual Appeal
#Operational Plan #Technical Approach #Diagram
-

Business Process Pentagon 3D Diagram – Visualizing Operational Plans
#Operational Plan #Technical Approach #Diagram
-

Weather Flow Diagram – Advanced Technical Planning
#Operational Plan #Technical Approach #Diagram
-

Chemical Lab Presentation Template – Blend of Data Analysis and Visualization
#Product/Service Introduction #Diagram #Composition
