Financial Planning Template Section Slide – Data-Driven Section Introduction
RJ0300022_3
- Last Update 04/23/2025
- File Size 1.4MB
- # of Slides 2
- File Format PPTX
- Slide Ratio 16:9
- Color
Keywords
About the Product
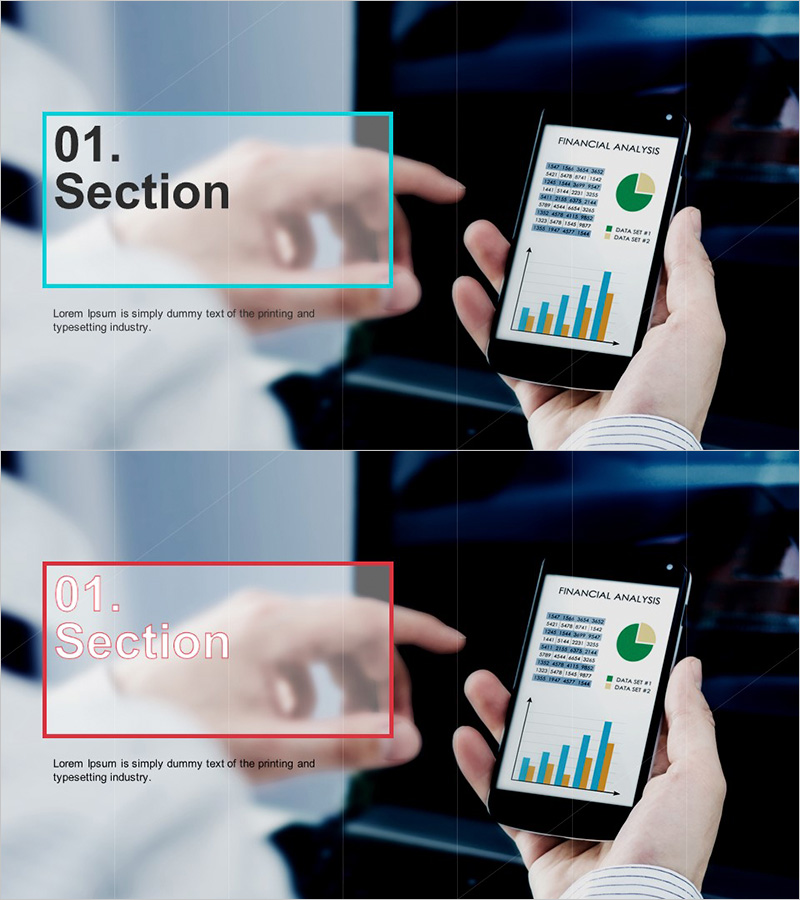
A section divider slide set designed for financial analysis and data-driven presentations. The layout features a cyan accent box on the left side with space for section number and title, paired with a mobile device image and financial analysis charts (pie chart and bar graph) on the right. The two-slide set includes color variations (cyan and red) for flexible multi-section use. The asymmetrical two-column design emphasizes data visualization while maintaining clean, uncluttered spacing. Fully editable in PowerPoint, ideal for financial planning, investment analysis, business reports, and quarterly performance presentations.
Usage Points
-
Main Usage
Marks the beginning of a new presentation section while reinforcing the credibility of financial and data-driven content. The section number and title clearly structure the document flow, while the right-side chart imagery visually signals a data-centric approach to the audience.
-
How to Use
Enter your section number and title in the left text box, and replace the right-side chart image with your own data visualization if needed. Use as a section divider in financial planning, investment analysis, business proposals, quarterly reports, and performance reviews to refocus audience attention and maintain document clarity.
-
Recommended For
Finance professionals, investment analysts, business planners, consultants, and financial managers presenting financial planning, investment returns, market analysis, and business performance reports. Particularly effective in data-driven business presentations where establishing credibility and clear structure is essential.
-
Slide Structure
Two-slide set with asymmetrical two-column layout. Left side features a cyan (or red) accent box with '01. Section' format for section number and title input. Right side contains a mobile device image and financial charts (pie chart and bar graph). Total of 1 text input area and 2 image areas per slide.
Related Products
-

Modern Office Theme Template Section Slide 02 – Design Inspiration
#Slide Type #Section Cover
-

Blood Donation Business Template Cover – Embracing Life
#Slide Type #Section Cover
-

New Semester Template Section Slide 03 – Enhancing Vibrancy in Learning
#Slide Type #Section Cover
-

Vacation PPT Section Slide02 – Capturing the Joy of Travel
#Slide Type #Section Cover
