Triangle PPT Template Wide – Modern Design
J0200036
- Last Update 01/06/2025
- File Size 21.2MB
- # of Slides 30
- File Format PPTX
- Slide Ratio 16:9
- Color
Slide Preview


Keywords
About the Product
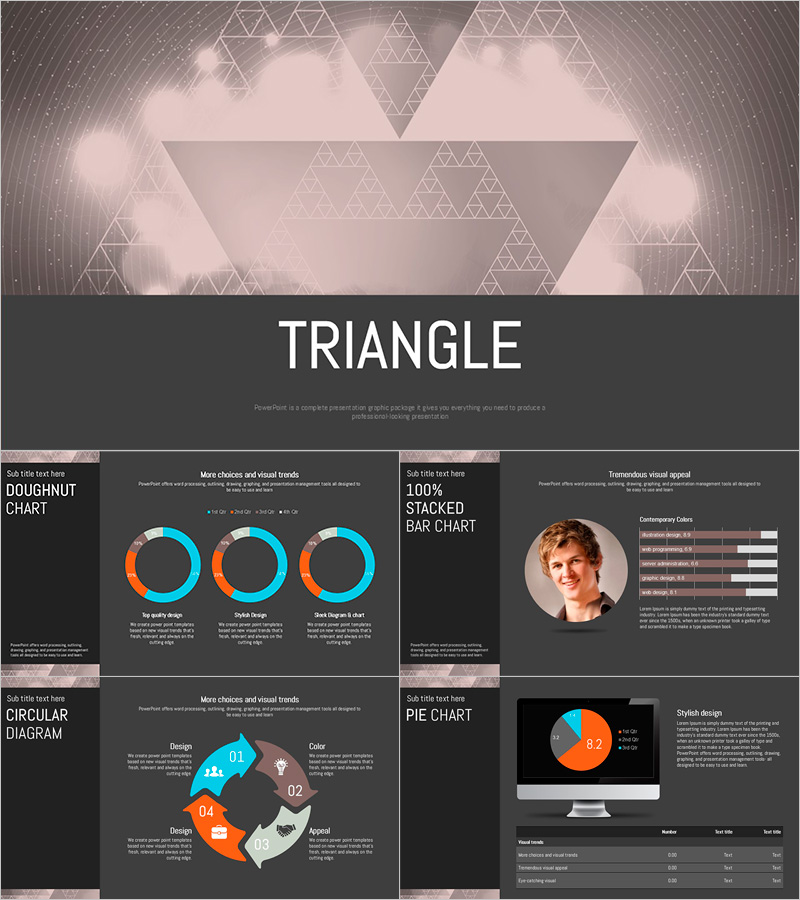
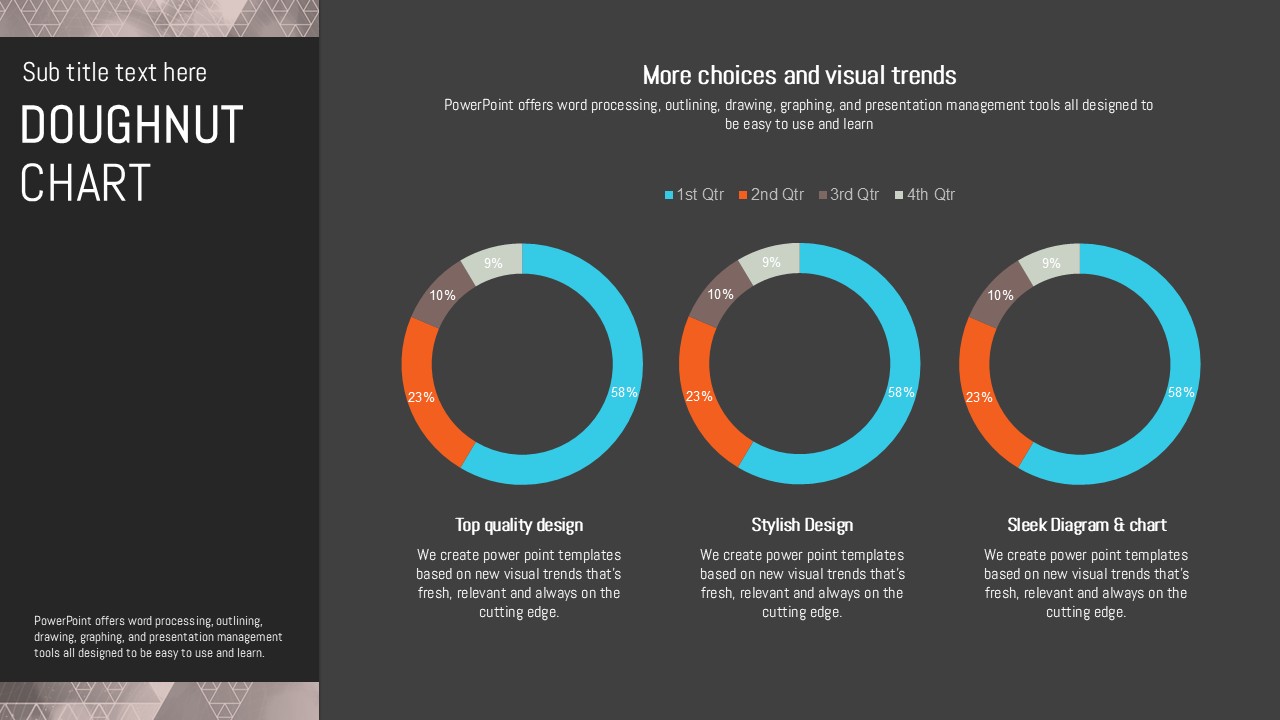
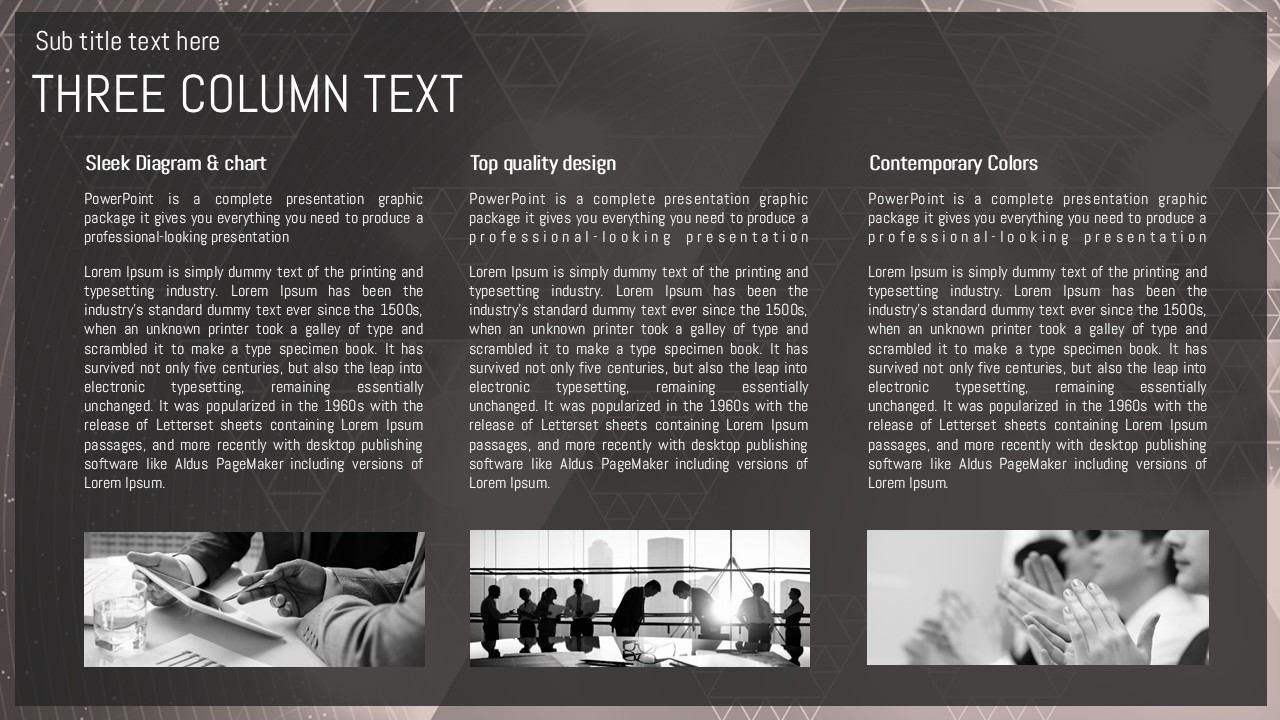
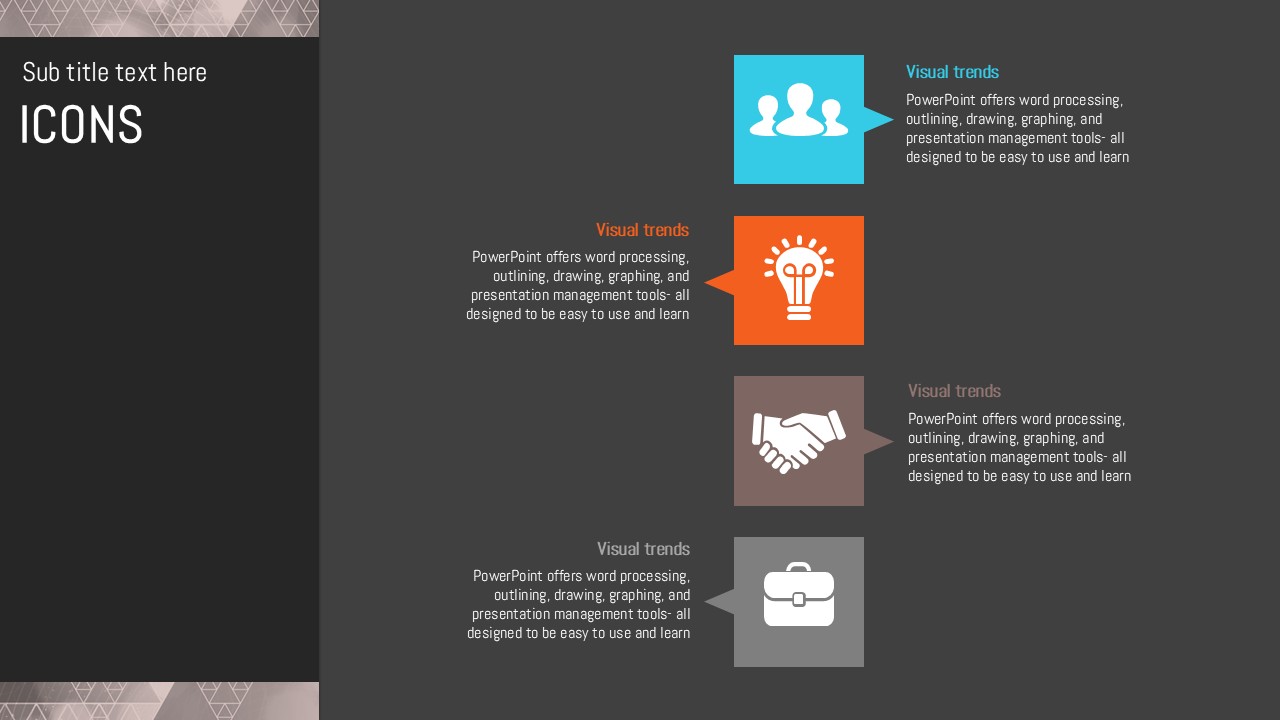
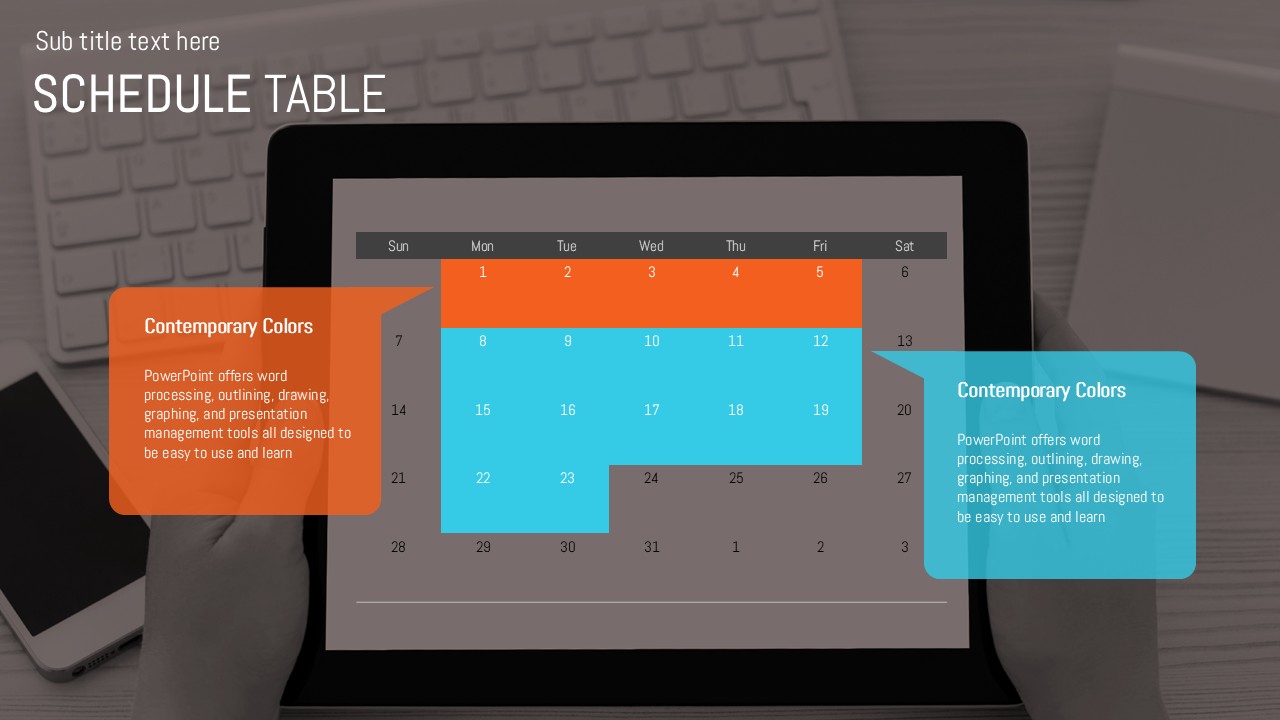
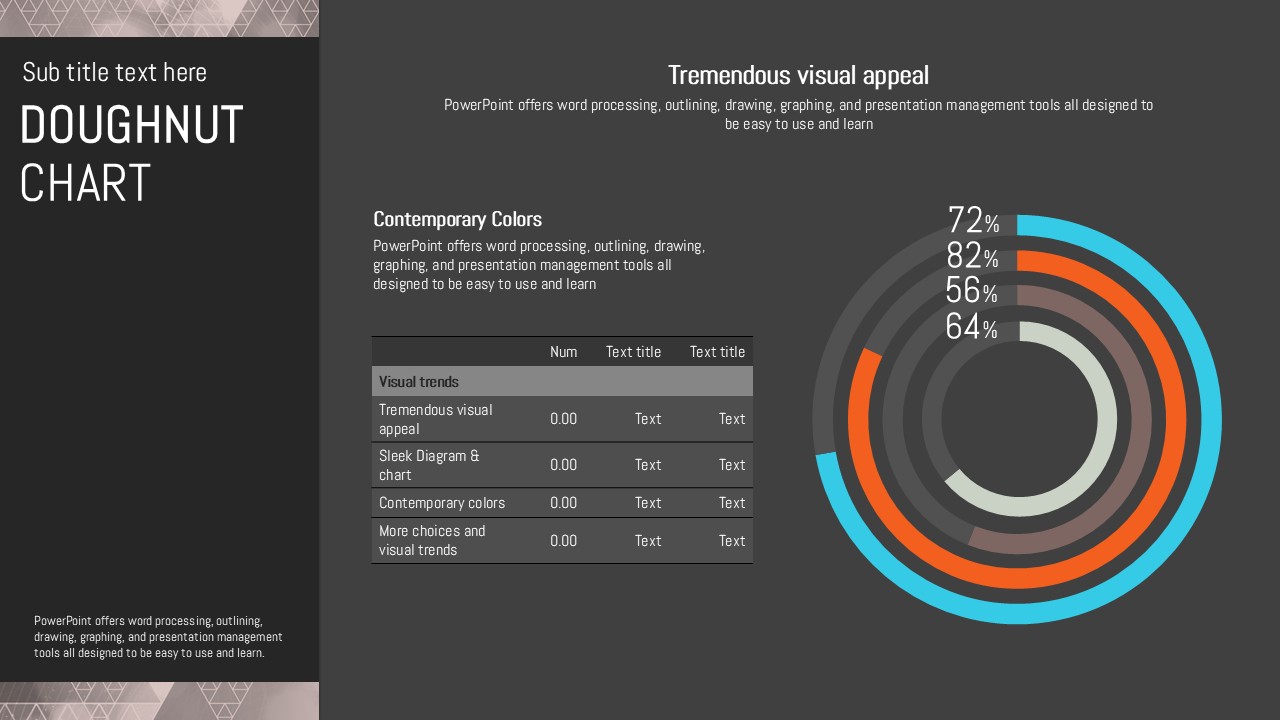
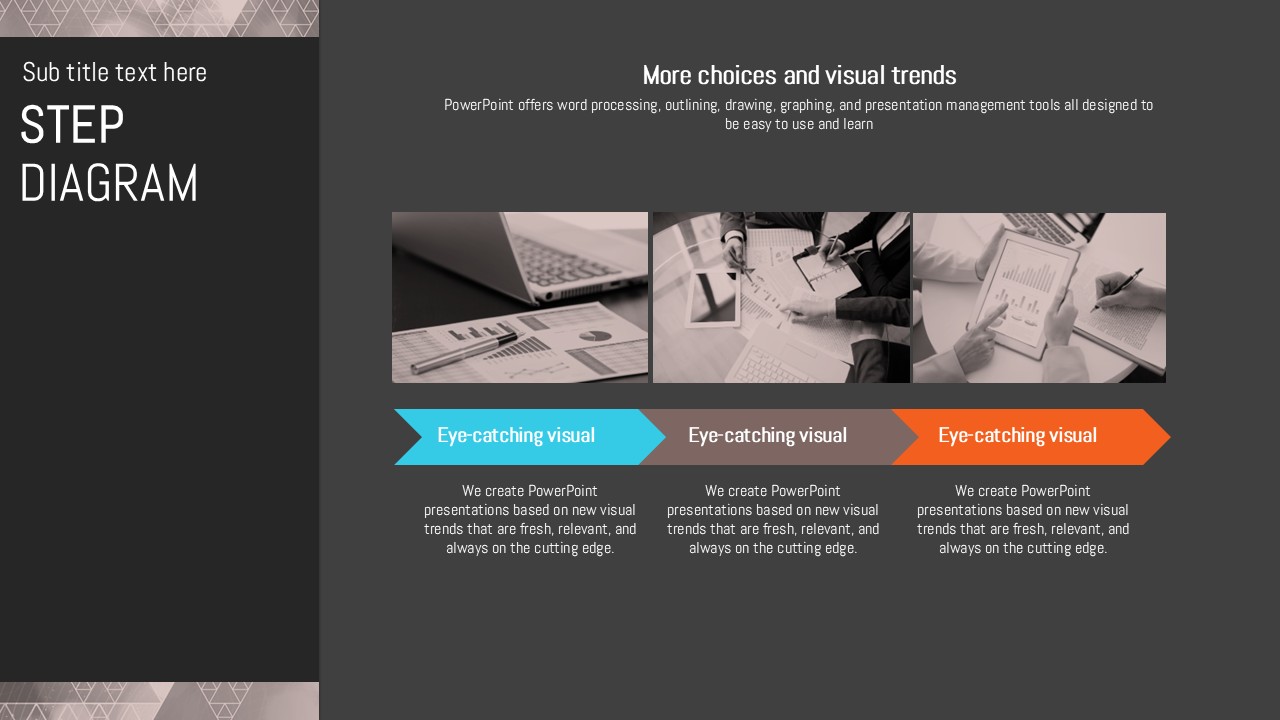
A professional business PowerPoint template featuring a dark charcoal and gray background with rose-gold triangle geometric patterns throughout. Teal and orange accent colors highlight charts and diagrams, making this presentation deck ideal for data-driven business slides. The 30-slide set includes a wide variety of data visualization layouts: donut charts, 100% stacked bar charts, circular diagrams, pie charts, and data tables — giving you everything needed for strategy presentations, performance reports, and project pitches. A balanced multi-column layout ensures strong information hierarchy across text, images, and charts. Delivered in fully editable PPTX format, all text, colors, and chart data can be customized to match your brand. Particularly well-suited for creative agencies, IT companies, and consulting firms that need a modern, authoritative look for client-facing or investor presentations.
Usage Points
-
Main Usage
Designed for data-driven business presentations including strategy decks, performance reports, and client pitches. The dark charcoal background with geometric accents creates a modern, authoritative impression that works well for corporate and creative contexts alike.
-
How to Use
Open the PPTX file and replace placeholder text, chart data, and colors with your own content. Select from donut charts, stacked bar charts, pie charts, circular diagrams, and data tables to build a complete presentation tailored to your specific reporting or pitching needs.
-
Recommended For
Best suited for strategists, marketers, and project managers at creative agencies, IT companies, and consulting firms. Ideal for investor meetings, team briefings, and client proposal sessions where a professional, visually impactful deck is required.
-
Slide Structure
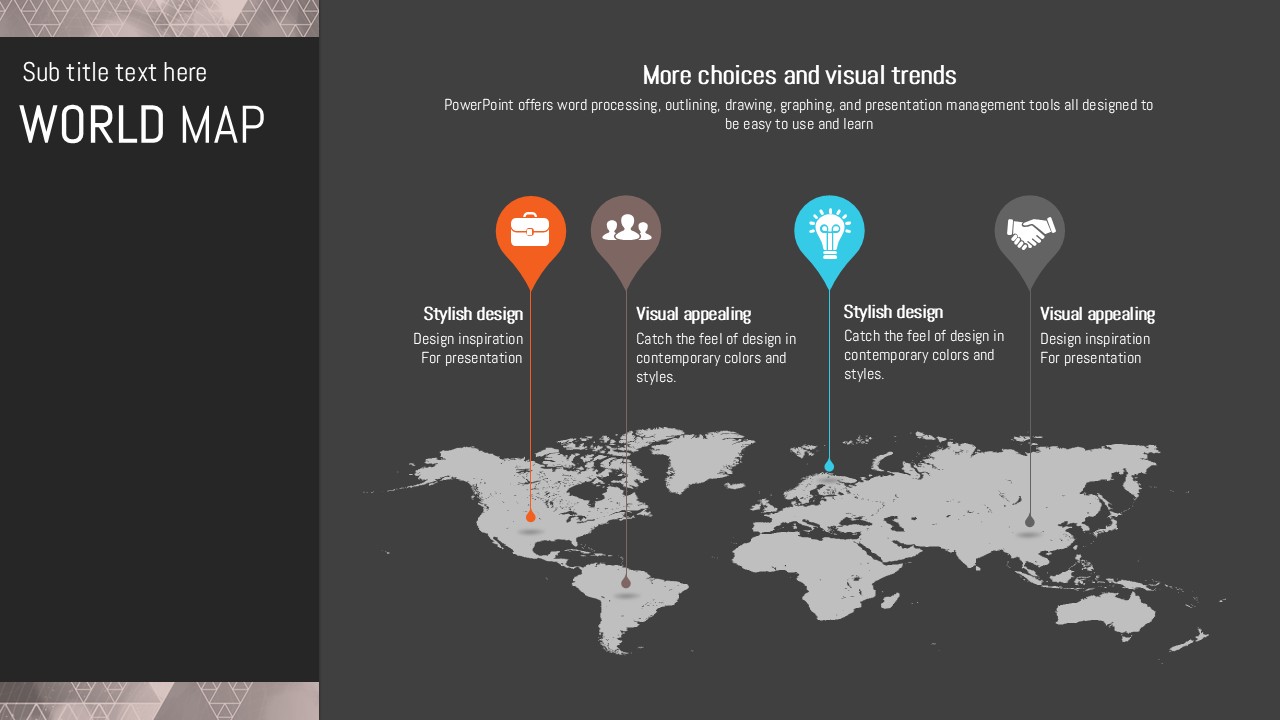
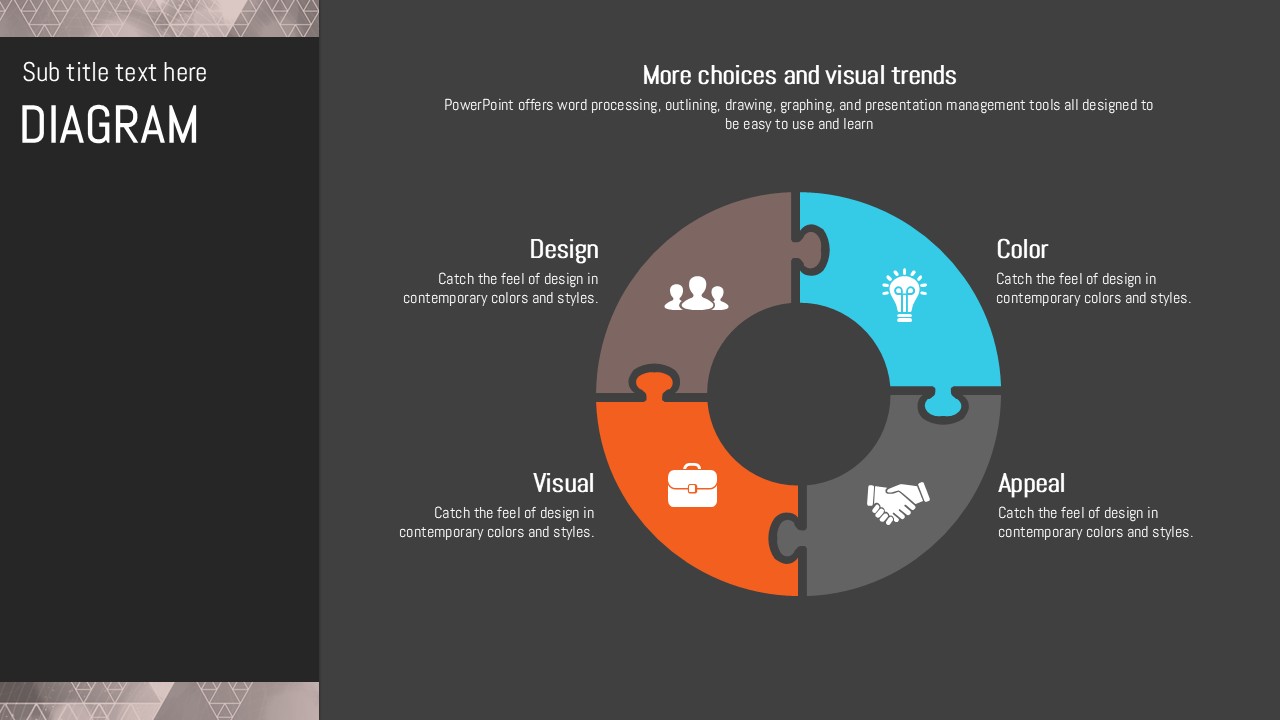
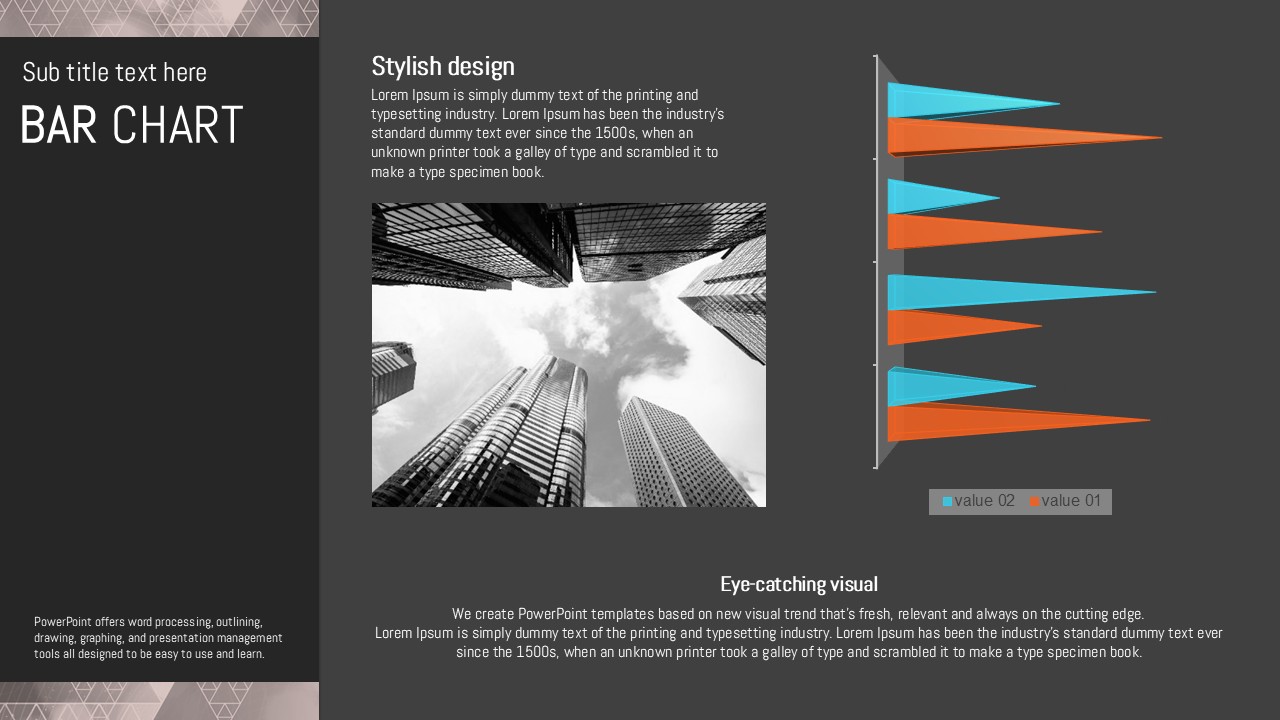
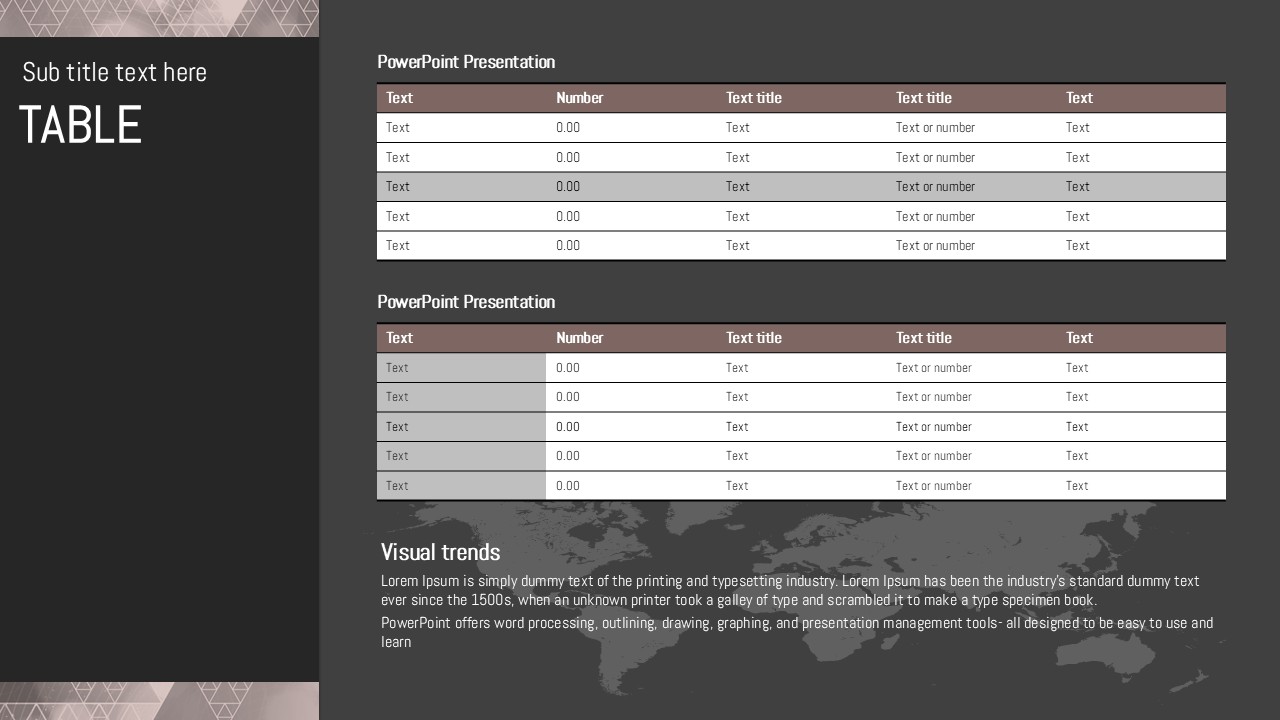
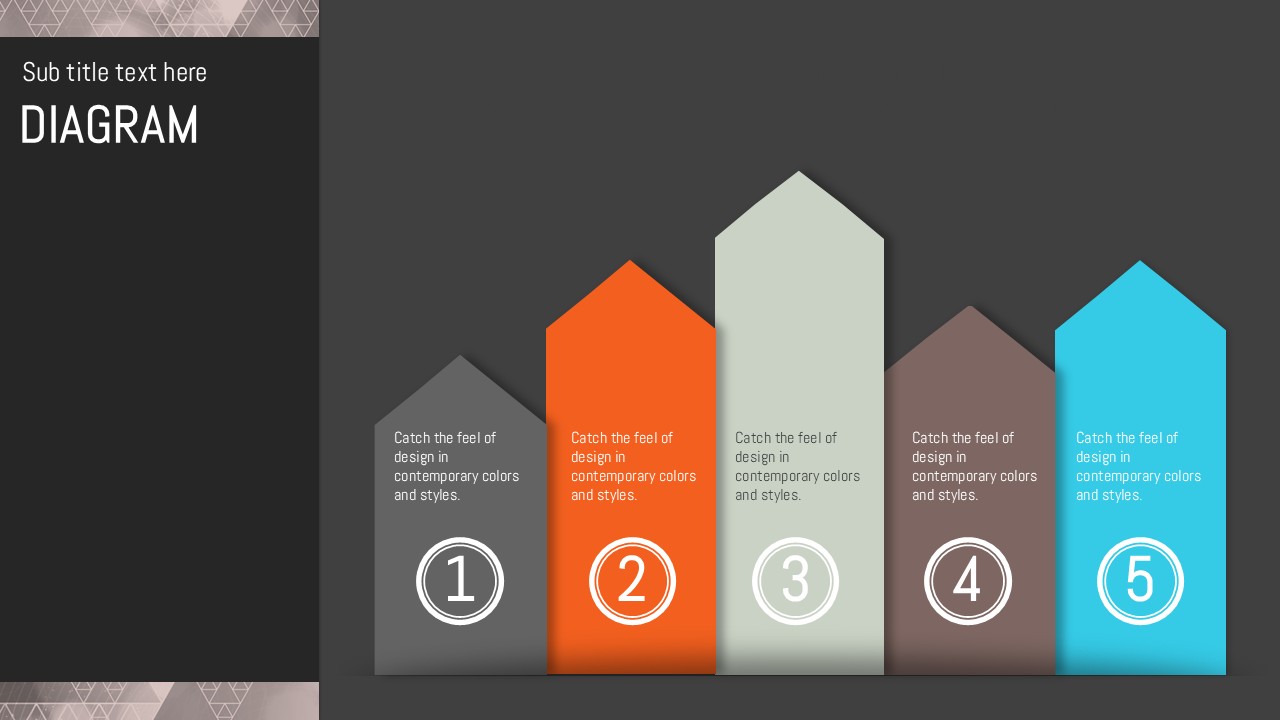
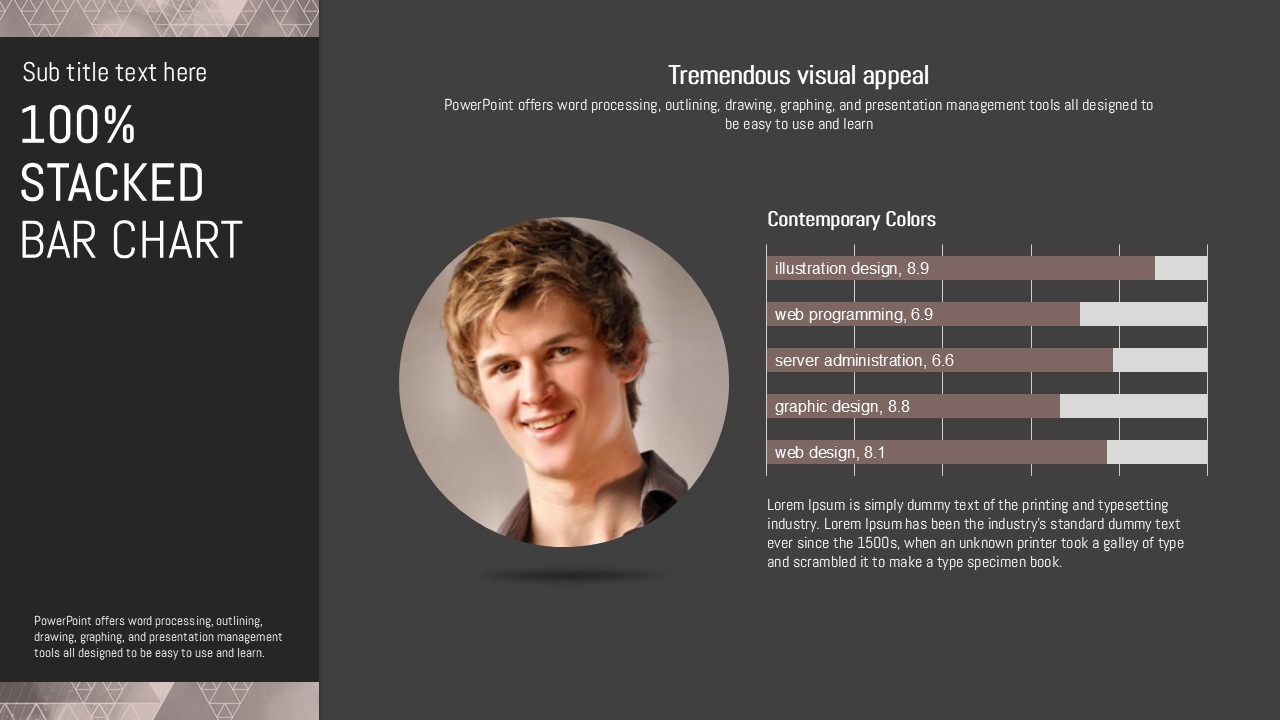
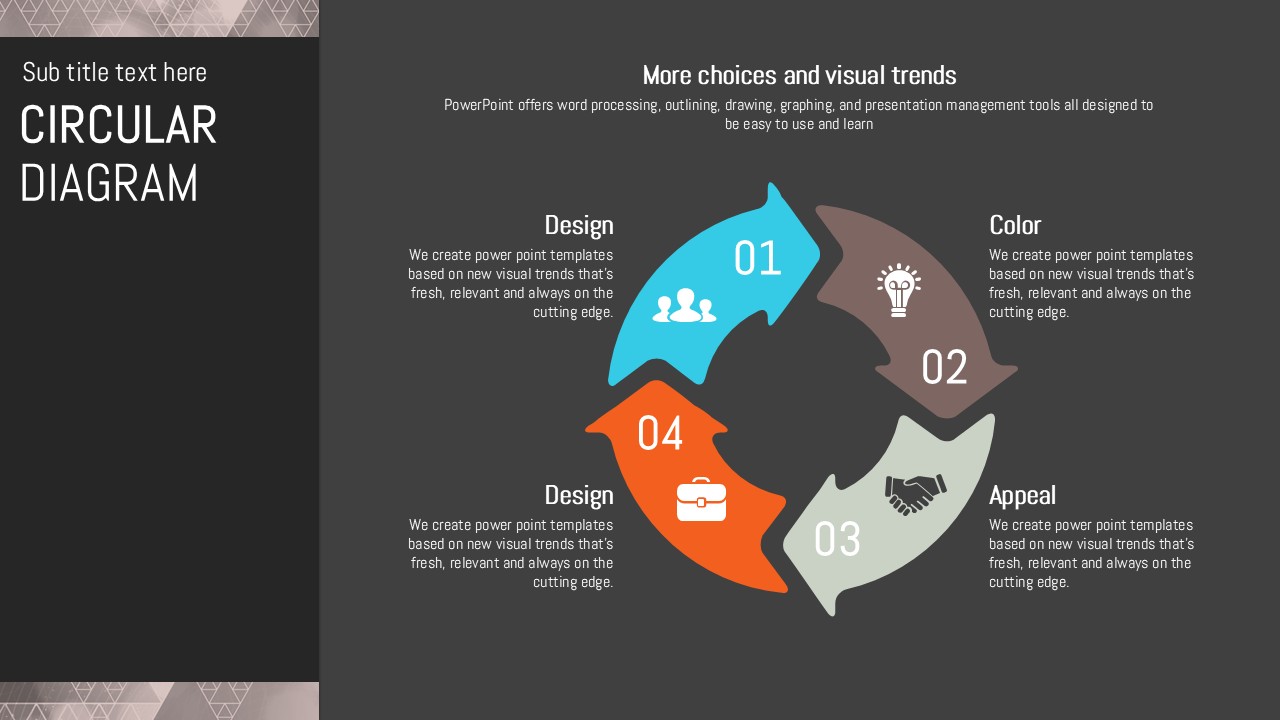
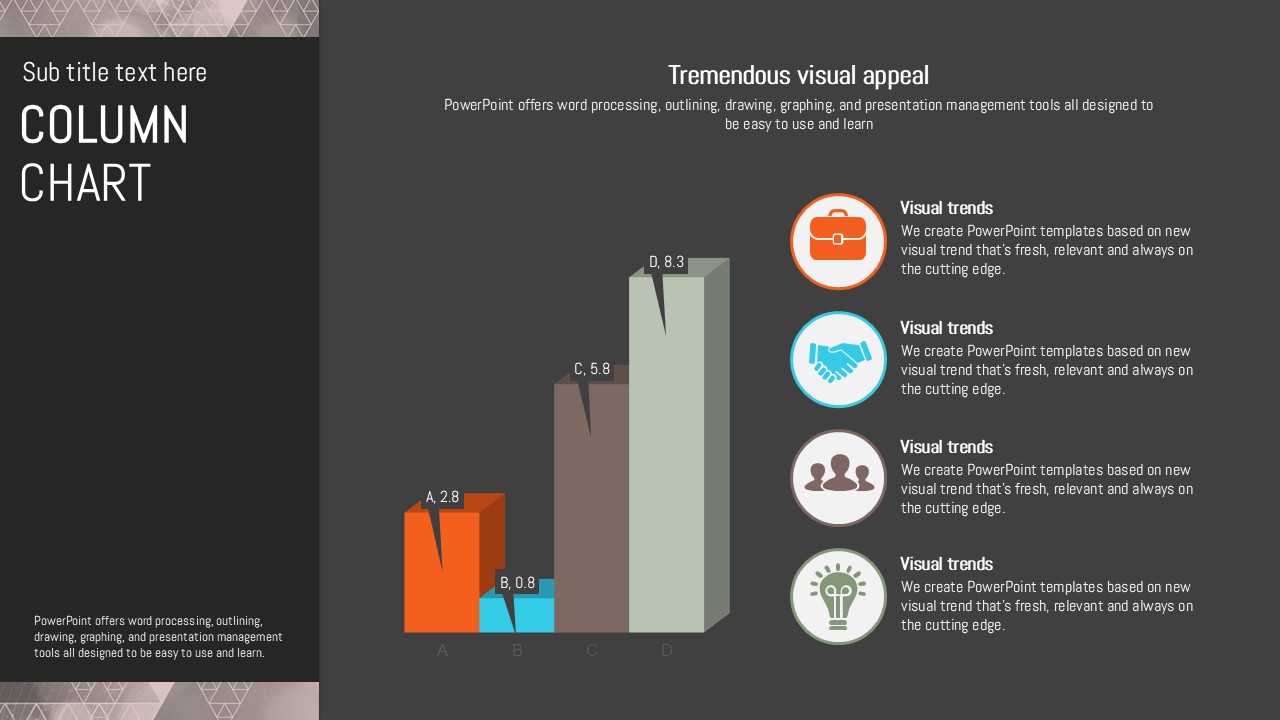
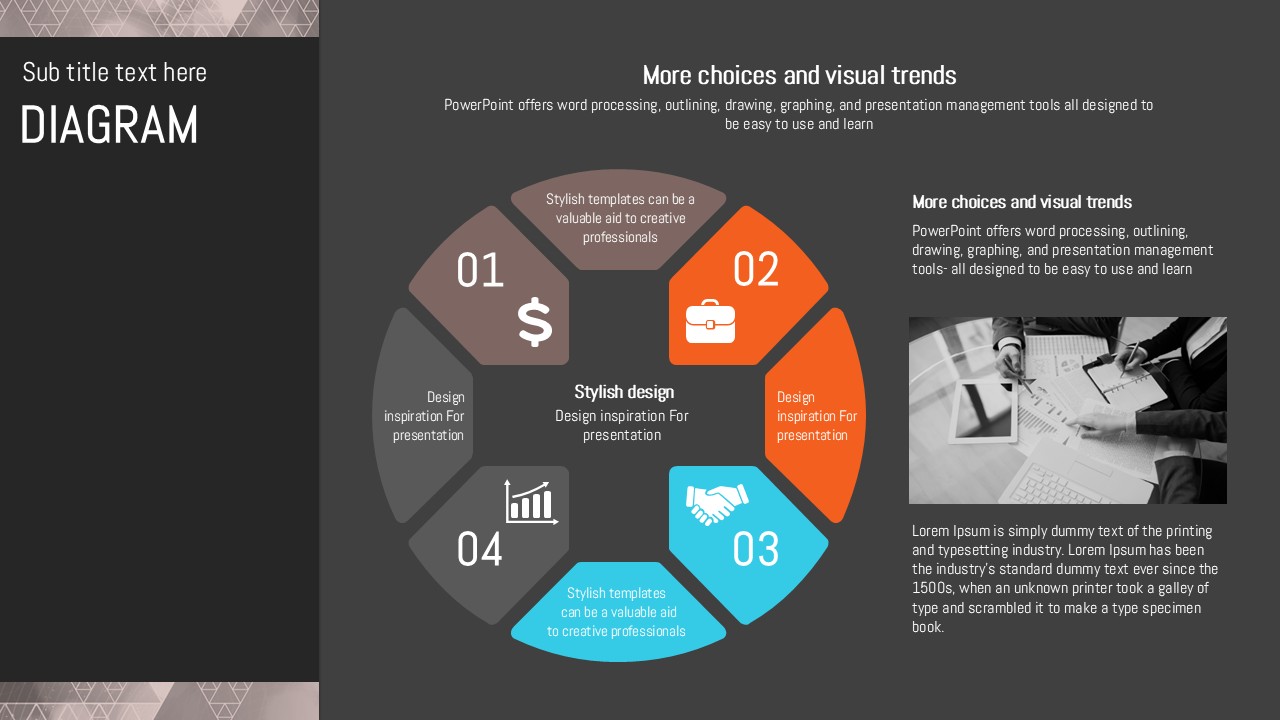
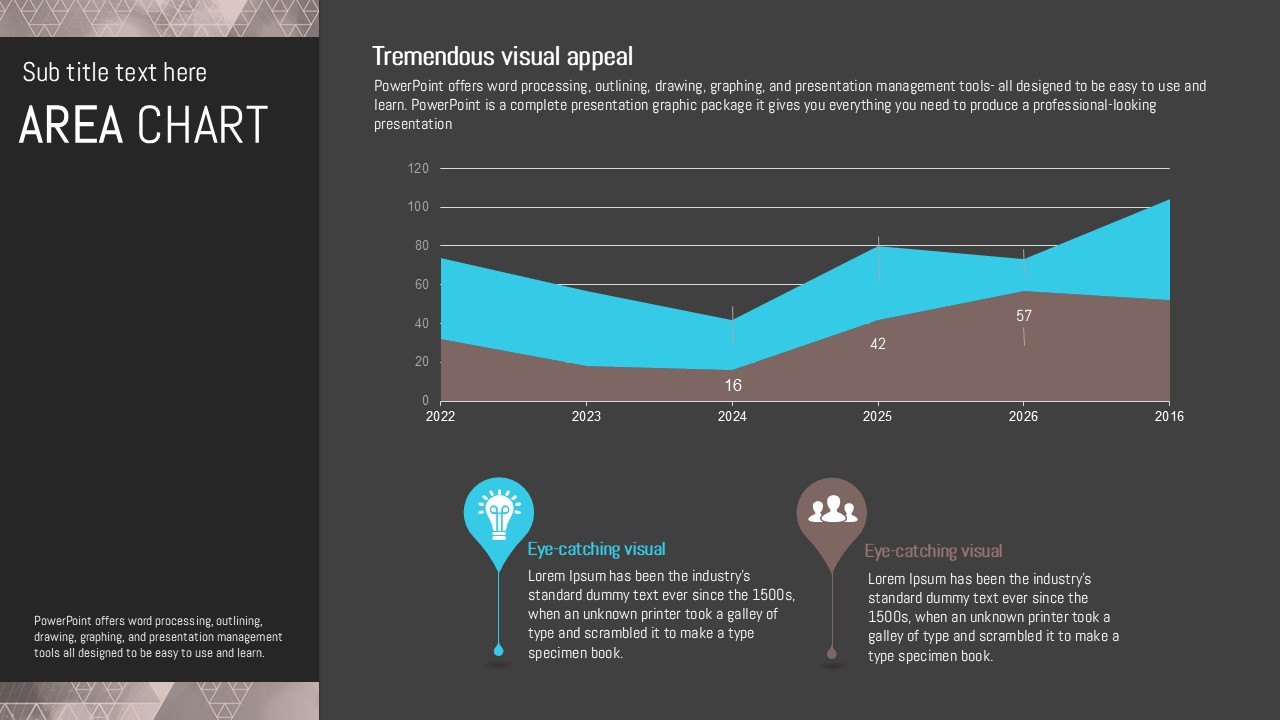
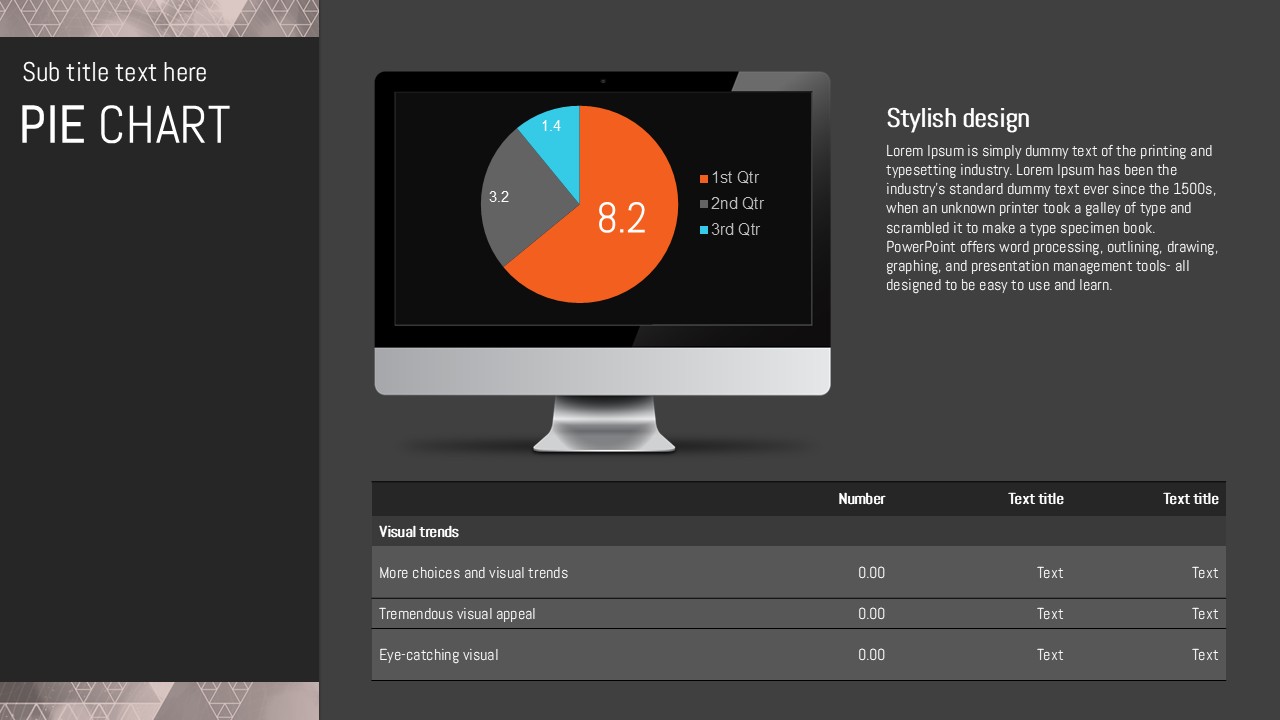
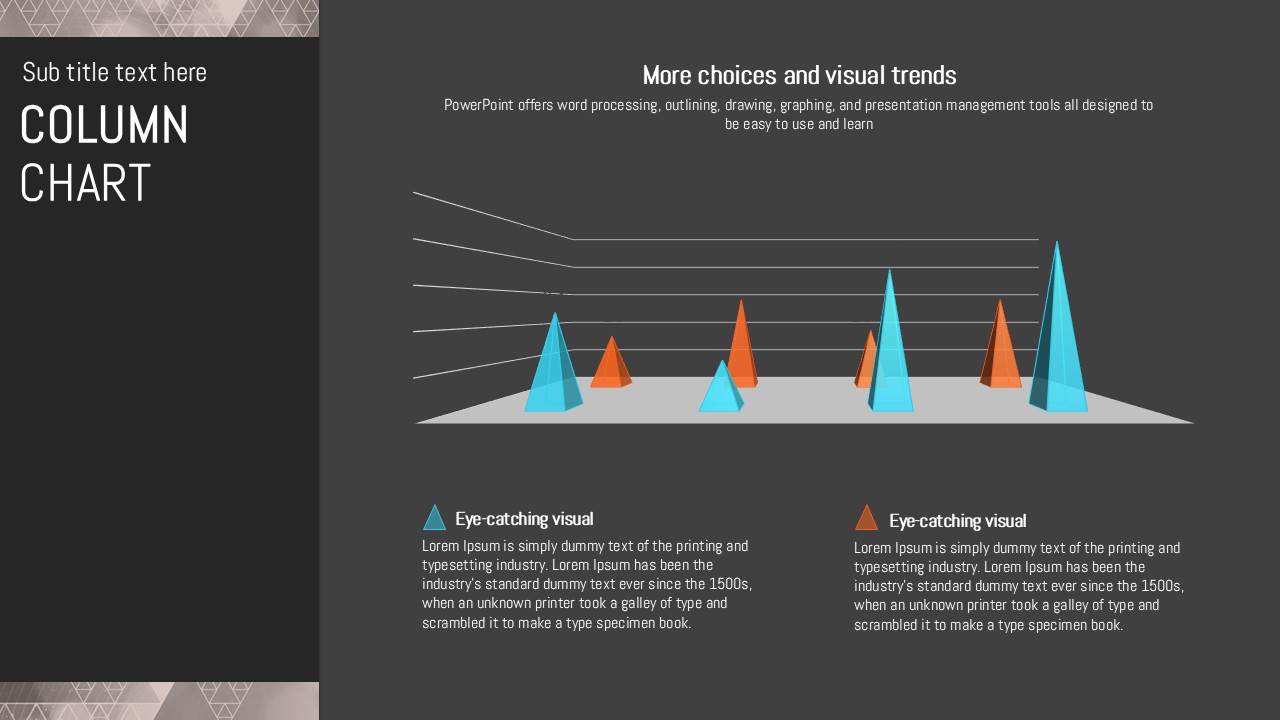
30 slides total: geometric triangle cover slide, 3-column donut chart comparison, 100% stacked bar chart, 4-step circular diagram, pie chart, bar chart with photo layout, and dual data tables with world map background — covering a full range of data visualization needs.


