Triangular Pattern Presentation Template Pie Chart – Market Analysis and Strategy
RJ0200036_27
- Last Update 04/08/2025
- File Size 0.3MB
- # of Slides 2
- File Format PPTX
- Slide Ratio 16:9
- Color
Keywords
- #Content-Based Slides
- #Design-Based Slides
- #Market and Competitor Analysis
- #Financial Plans and Performance
- #Diagram
- #Graph
- #Other
- #Market Share
- #Key Financial Indicators
- #Table
- #Circles
- #Standard Table
- #Pie Chart
- #16:9
- #pie chart PowerPoint slide
- #3-segment pie graph template
- #market share visualization
- #ratio data presentation
- #pie chart download PowerPoint
About the Product
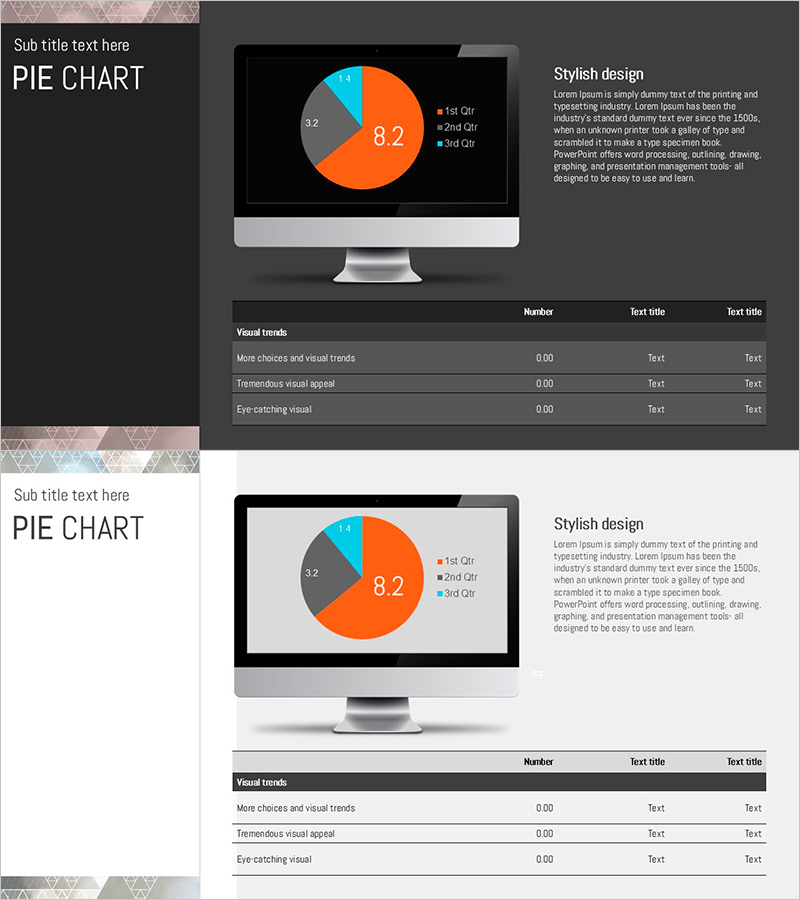
A professional pie chart PowerPoint slide featuring three data segments with triangular pattern background. The chart displays three series in orange (8.2), gray (3.2), and cyan (1.4) to represent market share, revenue composition, competitive analysis, or customer distribution. This 2-slide presentation template includes legend area and text fields for immediate data input. Ideal for business reports, financial presentations, market analysis briefings, and executive summaries requiring clear ratio visualization.
Usage Points
-
Main Usage
Visualize three key metrics or categories as proportional segments in a single pie chart. Ideal for presenting market share, revenue distribution, customer segments, or competitive positioning. Enables quick comparison and highlights dominant data points in executive presentations.
-
How to Use
Replace chart data values and legend labels with your actual figures. Adjust colors to match corporate branding guidelines. Use slide 1 for primary analysis and slide 2 for supporting data or detailed breakdown. All text fields are fully editable in PowerPoint.
-
Recommended For
Finance teams presenting quarterly results, marketing departments analyzing market segments, executives in strategy meetings, investor pitch decks, management consulting proposals. Best suited for situations requiring clear visualization of three major components or market divisions.
-
Slide Structure
Slide 1: Title area + 3-segment pie chart (orange 8.2, gray 3.2, cyan 1.4) + right-aligned legend box + descriptive text field. Slide 2: Identical layout for additional data. 16:9 widescreen format, PPTX file, 2-slide set.
Related Products
-

Target Area Market Share Analysis Graph – Emphasizing Market Competition
#Market and Competitor Analysis #Graph #Other
-

Market Analysis Slide for Major European Exporters
#Company Introduction #Market and Competitor Analysis #Graph
-

Sensuous Cloud Presentation Template Pie Chart – Sales and Market Analysis
#Company Introduction #Market and Competitor Analysis #Graph
-

Visualizing Market Analysis with Table and 3D Pie Chart
#Market and Competitor Analysis #Financial Plans and Performance #Diagram
