Triangular Pattern Presentation Table - Financial Plans and Performance
RJ0200036_11
- Last Update 04/08/2025
- File Size 0.6MB
- # of Slides 2
- File Format PPTX
- Slide Ratio 16:9
- Color
Keywords
- #Content-Based Slides
- #Design-Based Slides
- #Financial Plans and Performance
- #Diagram
- #Balance Sheet
- #Cash Flow Statement
- #Table
- #Standard Table
- #16:9
- #data table PowerPoint slide
- #financial table template
- #comparison table slide
- #5-row table design
- #performance analysis PowerPoint
- #table slide template download
About the Product
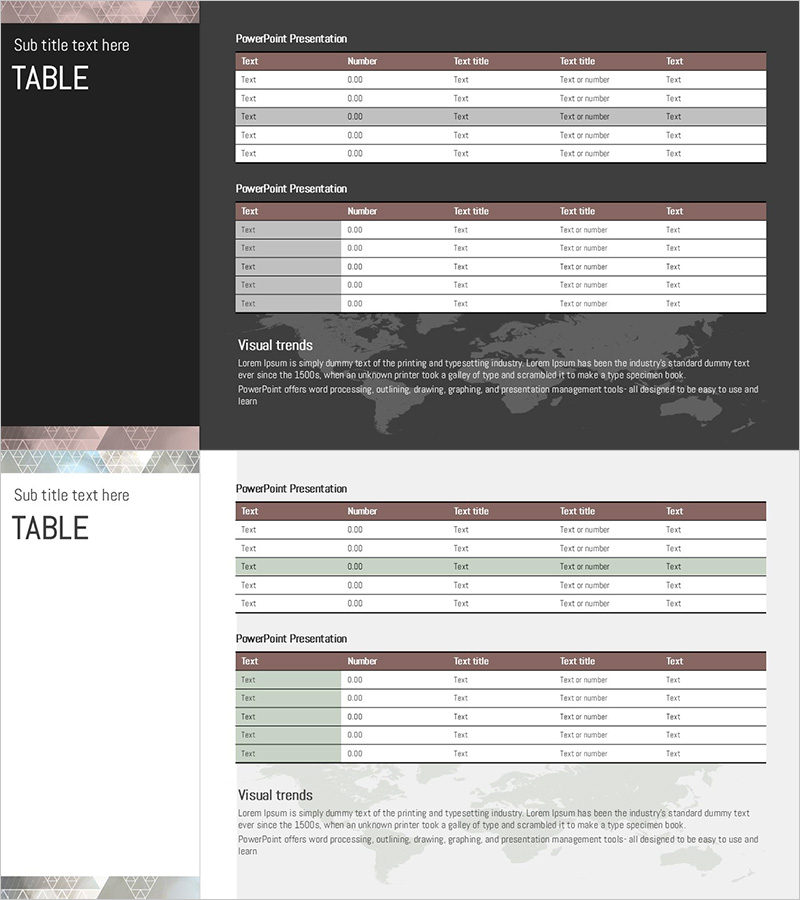
A 5-row data table PowerPoint slide designed for comparing financial plans with actual performance results. Features a dark brown header row and light gray alternating row backgrounds that enhance information hierarchy and readability. The two-slide set allows you to repeat the same layout for multiple datasets or present different financial metrics side by side. Optimized for 16:9 widescreen format, this presentation template is ready to use in financial reports, business plans, and performance analysis presentations.
Usage Points
-
Main Usage
Present financial data, sales figures, performance metrics, and key indicators in a structured table format. Ideal for plan-versus-actual comparisons, quarterly or monthly trend analysis, and departmental or product performance reviews.
-
How to Use
Replace the header labels and data values with your own content. Keep the dark brown header for emphasis and maintain the light gray alternating row backgrounds for readability. Duplicate the slides to add more datasets or create a multi-page financial report.
-
Recommended For
Finance teams, executives, business planners, and marketing professionals presenting quarterly reports, budget reviews, investor presentations, and management meetings. Perfect for data-driven decision-making sessions and stakeholder communications.
-
Slide Structure
Both slides follow an identical layout with a dark brown header row containing five columns (Text, Number, Text title, Text title, Text) and five data rows below. Light gray backgrounds alternate between rows to improve visual distinction and scanning efficiency.
Related Products
-

Circular Gradient Table – Financial Performance and Differentiation
#Financial Plans and Performance #Diagram #Balance Sheet
-

Data Analysis Table – Visualization of Financial Planning and Performance
#Financial Plans and Performance #Diagram #Balance Sheet
-

Volume Presentation Template - Laptop Mockup and Table Chart for Modern Proposals
#Financial Plans and Performance #Diagram #Other
-

Four Color Infographic Presentation Table – Visualizing Financial Performance
#Financial Plans and Performance #Diagram #Balance Sheet
