Triangular Pattern Presentation Template for Doughnut Chart
RJ0200036_14
- Last Update 04/08/2025
- File Size 0.2MB
- # of Slides 2
- File Format PPTX
- Slide Ratio 16:9
- Color
Keywords
- #Content-Based Slides
- #Design-Based Slides
- #Market and Competitor Analysis
- #Marketing Plan and Strategy
- #Graph
- #Market Analysis
- #Marketing Strategy
- #Circles
- #Doughnut Chart
- #16:9
- #doughnut chart PowerPoint slide
- #pie chart presentation template
- #ratio visualization
- #market analysis slides
- #data comparison template
About the Product
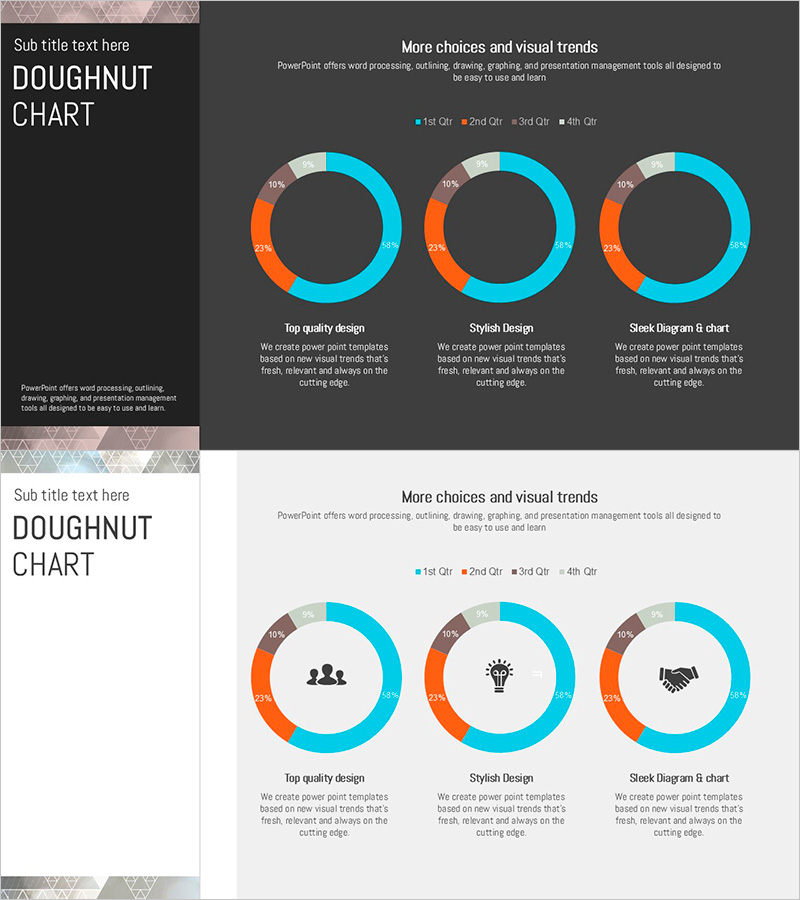
A doughnut chart PowerPoint slide designed to visualize market analysis and ratio data with clarity and impact. The slide features contrasting cyan and orange color segments representing four data divisions, with percentage values clearly labeled for intuitive data comparison. Paired with a triangular pattern background, this presentation template is ready to use for marketing plans, market share analysis, quarterly performance reports, and business presentations. The 2-slide set includes both dark and light background versions, allowing you to adapt the design to your presentation environment and audience preferences.
Usage Points
-
Main Usage
Clearly visualize the proportion of each item relative to the whole using doughnut chart design. Ideal for presenting market share, quarterly revenue composition, customer distribution, and product category sales breakdown with immediate visual impact.
-
How to Use
Use in marketing strategy presentations, business performance reports, and market analysis documents to emphasize ratio-based data. Replace percentage values with your actual data, and add legend labels and descriptive text as needed to enhance audience comprehension.
-
Recommended For
Marketing managers, sales directors, business analysts, financial officers, and executives presenting ratio-based data. Particularly effective for quarterly performance analysis, customer segmentation strategies, and product portfolio composition explanations.
-
Slide Structure
2-slide set with dark gray and light gray background versions. Each slide displays three doughnut charts for simultaneous multi-item comparison, using cyan, orange, and gray segments in a consistent 4-division structure for unified visual communication.
Related Products
-

Entertainment Business Analysis Graph - Market Analysis and Marketing Strategy
#Market and Competitor Analysis #Marketing Plan and Strategy #Diagram
-

Doughnut Chart Slide Visualizing Market Share by Country
#Market and Competitor Analysis #Graph #Other
-

Analyzing Market Share with 3 Donut Charts and Tables
#Market and Competitor Analysis #Diagram #Graph
-

Development Status Analysis Chart - Visualization for Effective Market Analysis
#Product/Service Introduction #Market and Competitor Analysis #Diagram
