Triangular Pattern Template for horizontal Bar Chart – Market and Competitive Analysis
RJ0200036_16
- Last Update 04/08/2025
- File Size 0.3MB
- # of Slides 2
- File Format PPTX
- Slide Ratio 16:9
- Color
Keywords
- #Content-Based Slides
- #Design-Based Slides
- #Company Introduction
- #Market and Competitor Analysis
- #Graph
- #Manpower
- #Customer Analysis
- #Horizontal Bar
- #Horizontal Bar Chart
- #16:9
- #horizontal bar chart PowerPoint
- #market analysis slide template
- #competitive analysis chart
- #5-item comparison graph
- #data visualization PowerPoint slide
About the Product
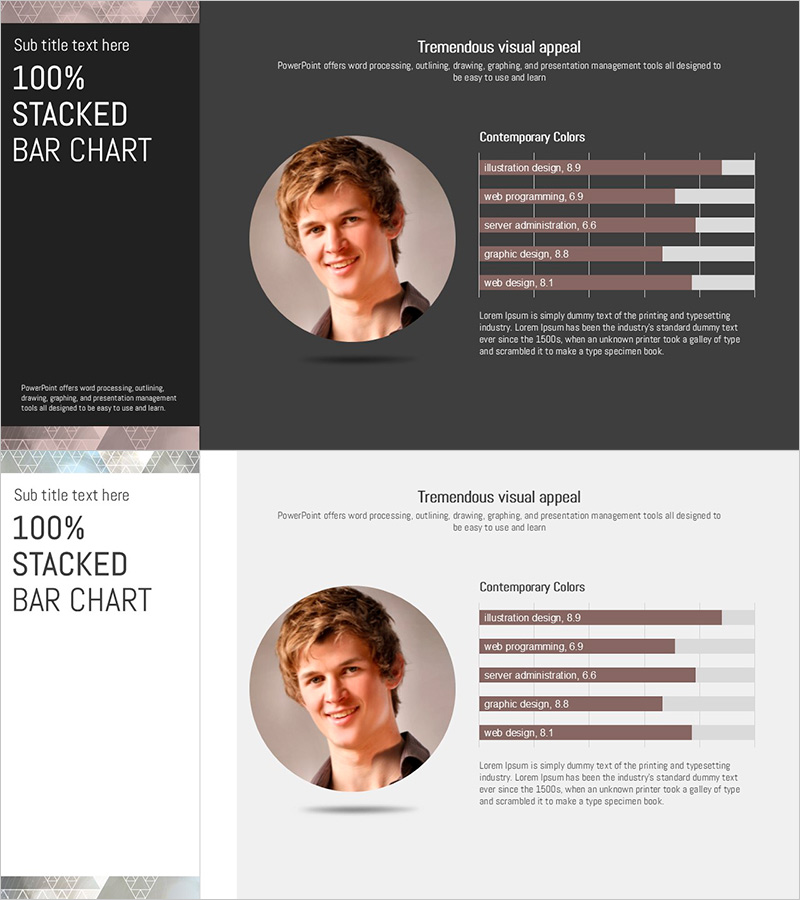
A horizontal bar chart PowerPoint slide for comparing market and competitive data across 5 items. The charcoal background with white and gray bar tones clearly expresses numerical comparisons, while the left triangular pattern design element provides visual emphasis. Features a circular profile image area for presenter information and is ready to use in marketing, sales, and strategy reports for competitive analysis and customer satisfaction benchmarking. The 2-slide set includes both charcoal and light background versions to match your presentation environment.
Usage Points
-
Main Usage
Intuitively compares numerical data across 5 items—such as market size, competitor performance, or customer satisfaction—using a horizontal bar chart. The charcoal background reinforces data credibility, while the left triangular pattern design serves as a visual anchor point.
-
How to Use
Place in the competitive analysis section of marketing strategy reports, sales presentations, or executive briefings. Edit bar lengths and values with actual data, then add analysis interpretation in the right text area. Insert presenter or team member photos in the circular profile image area.
-
Recommended For
Marketing and sales professionals, strategy report writers, market research analysts, and consulting firms. Ideal for any presentation requiring quantitative data analysis—competitor benchmarking, customer satisfaction surveys, market share comparisons, and performance metrics.
-
Slide Structure
2-slide set with charcoal (dark gray tone) and light (bright gray tone) background versions. Each slide features a left triangular pattern design area, center circular profile image zone, right 5-item horizontal bar chart, and bottom text space for analysis commentary.
Related Products
-

Paint Splash Presentation Template for Team Members
#Company Introduction #Market and Competitor Analysis #Graph
-

Horizontal Bar Chart for Professional Team Human Resources Analysis
#Company Introduction #Market and Competitor Analysis #Diagram
-

Key Personnel Ability Analysis Graph – Highlighting Company Core Strengths
#Company Introduction #Market and Competitor Analysis #Graph
-

Work Capabilities Analysis Diagram – Analysis of Key Personnel Work Performance
#Company Introduction #Market and Competitor Analysis #Diagram
