Triangular Pattern Column Chart Template – Market Competitive Advantage Analysis
RJ0200036_28
- Last Update 04/08/2025
- File Size 0.2MB
- # of Slides 2
- File Format PPTX
- Slide Ratio 16:9
- Color
Keywords
About the Product
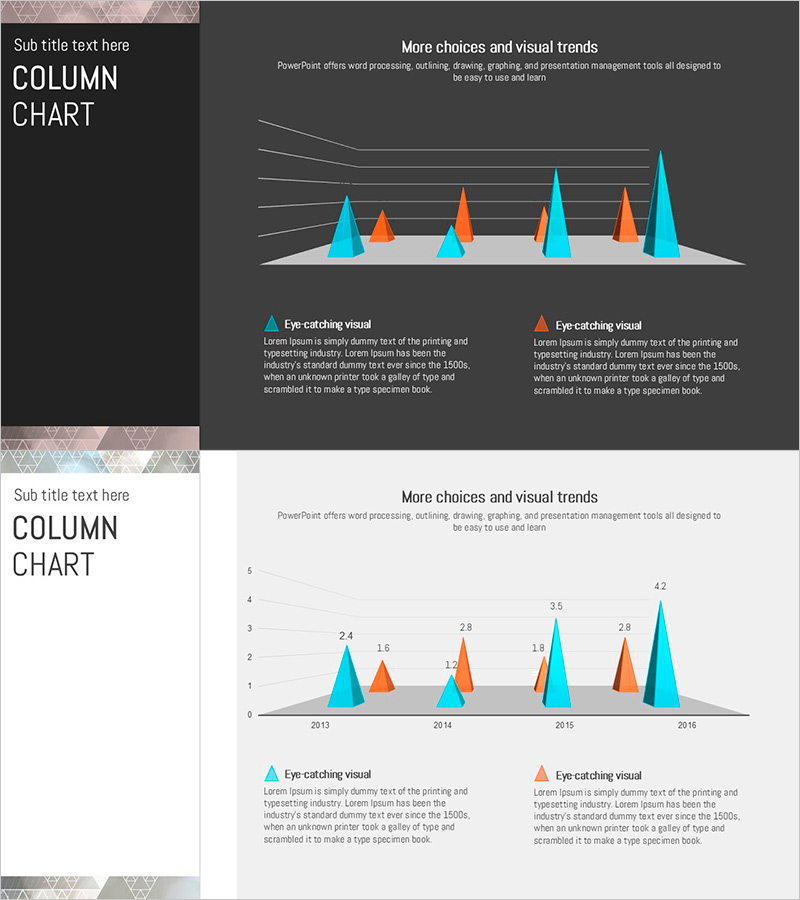
A professional triangular pattern column chart PowerPoint slide designed for competitive market analysis and performance benchmarking. The slide features two data series in cyan and blue tones, enabling intuitive year-over-year and item-by-item numerical comparisons. Each slide includes a legend and descriptive text area at the bottom to clearly communicate insights. The 16:9 widescreen format with 2-slide composition allows immediate insertion into business presentations, with full editability of colors and values. Ideal for executive reports, marketing strategy presentations, business performance analysis, and competitive positioning discussions.
Usage Points
-
Main Usage
Visualizes year-over-year and item-by-item numerical comparisons with competitive advantage analysis. The triangular data point representation draws focus, while the two-series color contrast clearly communicates relative performance differences. Suitable for executive reports, marketing strategy presentations, and business performance analysis.
-
How to Use
Adjust the height and position of triangular shapes to input actual data values. Populate the legend and descriptive text areas to reinforce chart meaning and analysis context. Colors are fully customizable to match corporate branding, and the 2-slide format allows sequential presentation of multiple metrics.
-
Recommended For
Recommended for executive and C-level quarterly and annual performance reports, marketing team competitive market analysis presentations, sales team performance comparison pitches, and strategic planning team business direction sessions. Applicable to all business scenarios requiring data-driven decision-making.
-
Slide Structure
2-slide composition. Each slide features a title area at the top, a central chart area with 6–8 triangular shapes in cyan and orange dual-series format, and a legend with descriptive text box at the bottom. Optimized for 16:9 widescreen format in modern presentation environments.
Related Products
-

Vertical Bar Chart for Data Analysis Visualization – Efficiency and Practicality
#Market and Competitor Analysis #Graph #Competitor Analysis
-

Four Color Infographic Bar Chart Template – Visualize Your Competitive Advantage
#Market and Competitor Analysis #Graph #Competitor Analysis
-

Analyzing 2 Comparison Graphs - Slides for Deriving Competitive Advantage
#Market and Competitor Analysis #Graph #Competitor Analysis
-

Business Bundle Bar Graph – Market Analysis and Competitive Edge
#Market and Competitor Analysis #Graph #Competitor Analysis
