Triangular Pattern Presentation Template – Business Strategy & Market Analysis
RJ0200036_18
- Last Update 04/08/2025
- File Size 0.2MB
- # of Slides 2
- File Format PPTX
- Slide Ratio 16:9
- Color
Keywords
- #Content-Based Slides
- #Design-Based Slides
- #Business Strategy
- #Market and Competitor Analysis
- #Graph
- #Competitive Advantage
- #Line
- #Line Chart
- #Project Progress
- #16:9
- #line chart PowerPoint slide
- #3-series trend analysis
- #business progress report template
- #market analysis chart
- #PowerPoint slide download
About the Product
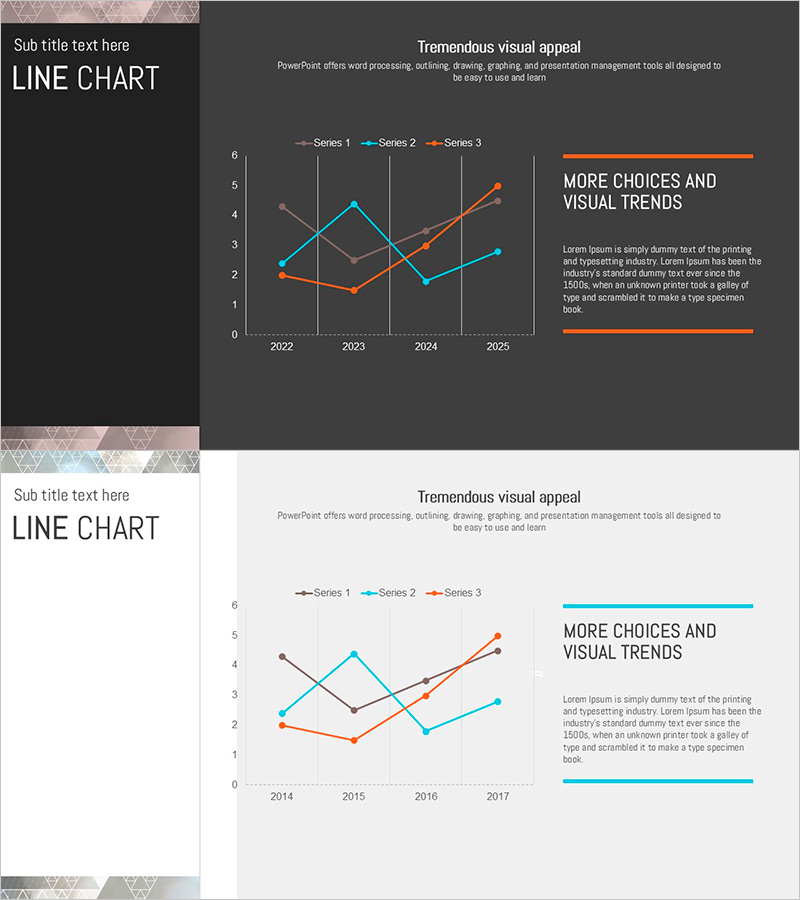
A professional PowerPoint slide featuring a multi-series line chart with three data series (orange, cyan, and gray) tracking trends from 2022 to 2025 on a dark background. The chart clearly visualizes data intersections, upward and downward patterns, and volatility across the four-year period. Triangular pattern design elements frame the left side, creating visual cohesion throughout your presentation. The right side includes dedicated text areas for highlighting key insights and conclusions. This slide template is ready to use for business progress reports, market analysis, competitive positioning, and strategic planning presentations.
Usage Points
-
Main Usage
Designed to compare and analyze quantitative data trends across three variables over a four-year period. The chart effectively highlights data intersections, growth patterns, and volatility, making it ideal for business performance reports, market share evolution, competitive benchmarking, and strategic decision-making presentations.
-
How to Use
Enter your analysis topic (e.g., Business Progress, Market Analysis) in the left title area and add key insights in the right text boxes. Modify the chart legend, axis labels, and data points to match your dataset. The dark background ensures excellent visibility in projector environments and professional appearance in both digital and printed formats.
-
Recommended For
Executives, business unit managers, marketing professionals, data analysts, and consultants presenting quarterly or annual business performance, market trends, competitive strategies, and investment pitches. Suitable for investor relations (IR), business plans, marketing strategies, and executive reports requiring quantitative data visualization.
-
Slide Structure
Two-slide layout with left title area (triangular pattern background) and right chart area. The line chart features 4 time periods on X-axis (2022-2025), Y-axis range 0-6, and 3 data series. Two text boxes on the right are positioned for emphasis and key message placement.
Related Products
-

Social Network Wide Template Line Chart - Market Competition Analysis
#Business Strategy #Market and Competitor Analysis #Graph
-

Learning Goal Deflection Line Graph – Business Strategy
#Business Strategy #Market and Competitor Analysis #Graph
-

Five Color Wide Template – Horizontal Line Graph for Business Strategy
#Business Strategy #Market and Competitor Analysis #Graph
-

Square Frame Presentation Template for Line Chart – Market and Competitive Analysis
#Business Strategy #Market and Competitor Analysis #Graph
