Triangular Pattern Presentation Template Area Chart – Market Analysis and Competitive Edge
RJ0200036_26
- Last Update 04/08/2025
- File Size 0.2MB
- # of Slides 2
- File Format PPTX
- Slide Ratio 16:9
- Color
Keywords
About the Product
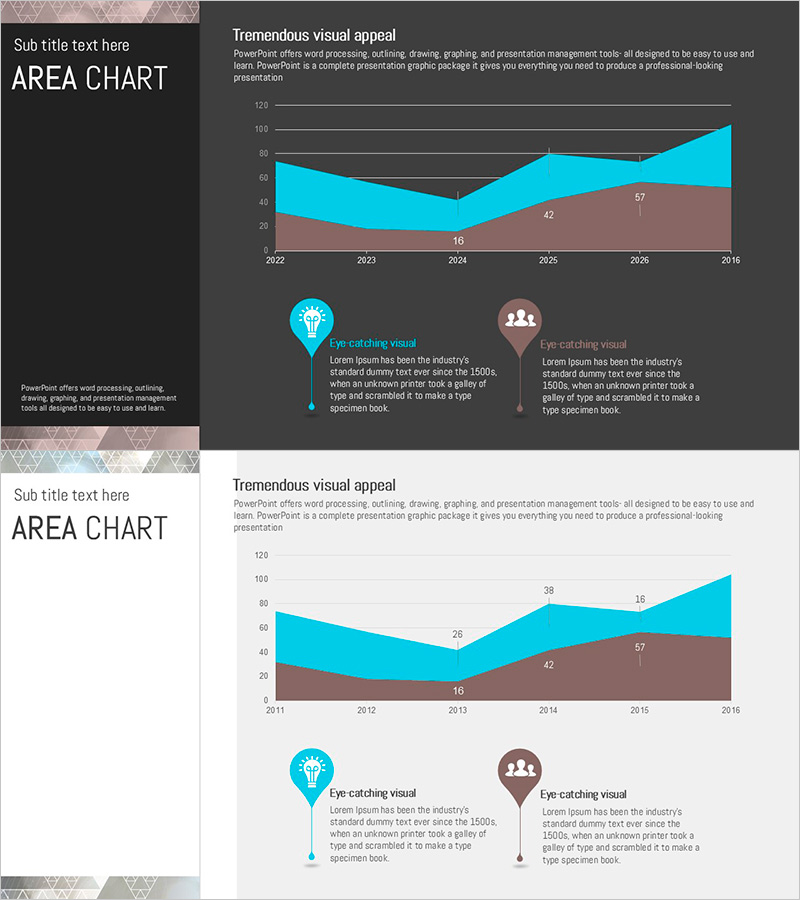
A professional area chart PowerPoint slide designed for market analysis and competitive positioning presentations. This slide visualizes two data series over time using stacked area regions in cyan and brown tones on a dark background, making trend changes and ratio relationships immediately apparent. Each slide includes icon-based annotation areas to highlight key insights and findings. The 16:9 widescreen format with 2 slides is ready for immediate use in business presentations, reports, and strategic planning sessions.
Usage Points
-
Main Usage
Ideal for displaying cumulative trends of two or more data series over time. Perfect for presenting market share evolution, revenue composition, customer segment changes, and other ratio-dependent analyses. The distinct area boundaries make it easy to track individual series changes while showing their combined impact.
-
How to Use
Replace the chart data values with your actual figures and update axis labels and legend text to match your presentation context. Modify the annotation text in the icon sections to highlight key insights. You can adjust the area colors to match your corporate brand while maintaining the dark background aesthetic.
-
Recommended For
Recommended for executive reports, business analysis presentations, marketing strategy sessions, financial performance reviews, and market research findings. Ideal for executives, analysts, and marketing professionals who need data-driven decision-making visuals.
-
Slide Structure
2-slide set with each slide featuring a 2-series stacked area chart (timeline 2022-2028, value axis 0-120) and two icon-based annotation areas. Data point values are displayed at chart base, with dedicated text input spaces beside each icon for key message insertion.
Related Products
-

Gradient Theme Area Diagram – Market and Competitor Analysis
#Market and Competitor Analysis #Diagram #Graph
-

Office Supplies Theme Area Graph – Market Analysis and Competitor Comparison
#Market and Competitor Analysis #Graph #Other
-

Abstract Pattern Area Chart Template – Distinctive Data Visualization
#Market and Competitor Analysis #Graph #Other
-

Three-Dimensional Graph Analysis – Market and Competitor Analysis Slide
#Product/Service Introduction #Market and Competitor Analysis #Marketing Plan and Strategy
