
Businessman Template – Sleek and Professional Design
J0300040
- Last Update 01/06/2025
- File Size 6.2MB
- # of Slides 20
- File Format PPTX
- Slide Ratio 16:9
- Color
Slide Preview


Keywords
About the Product
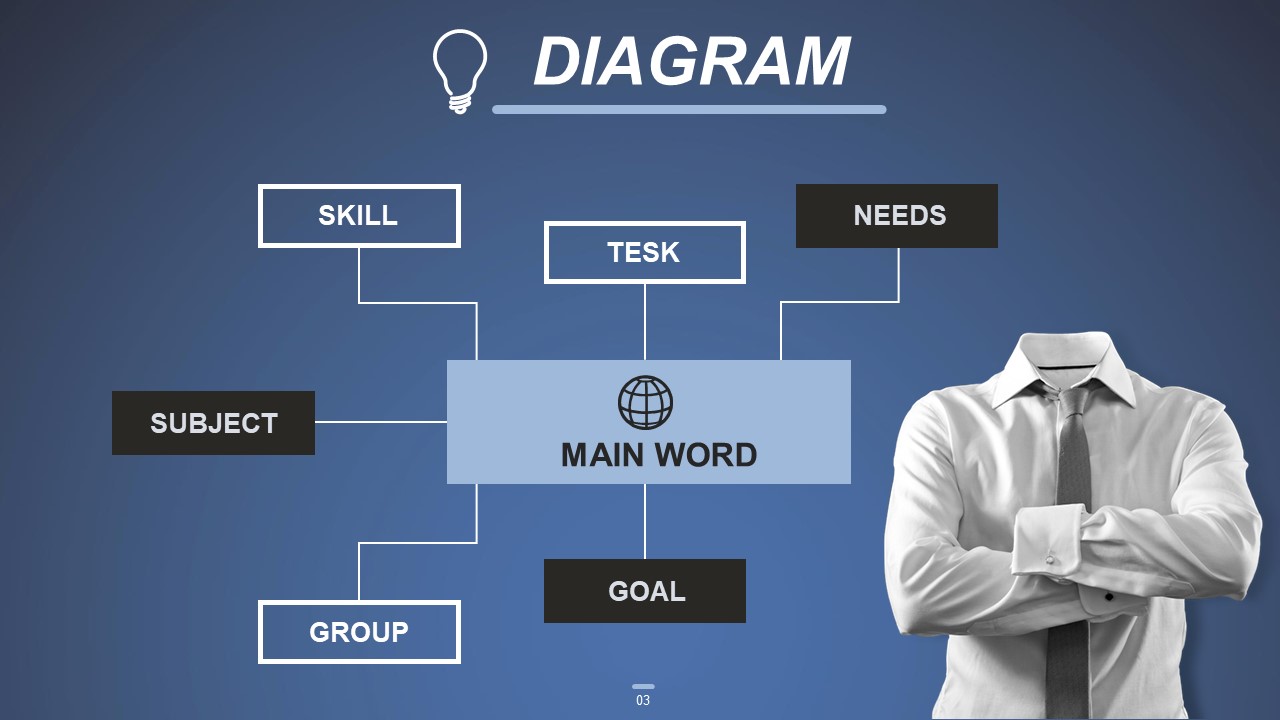
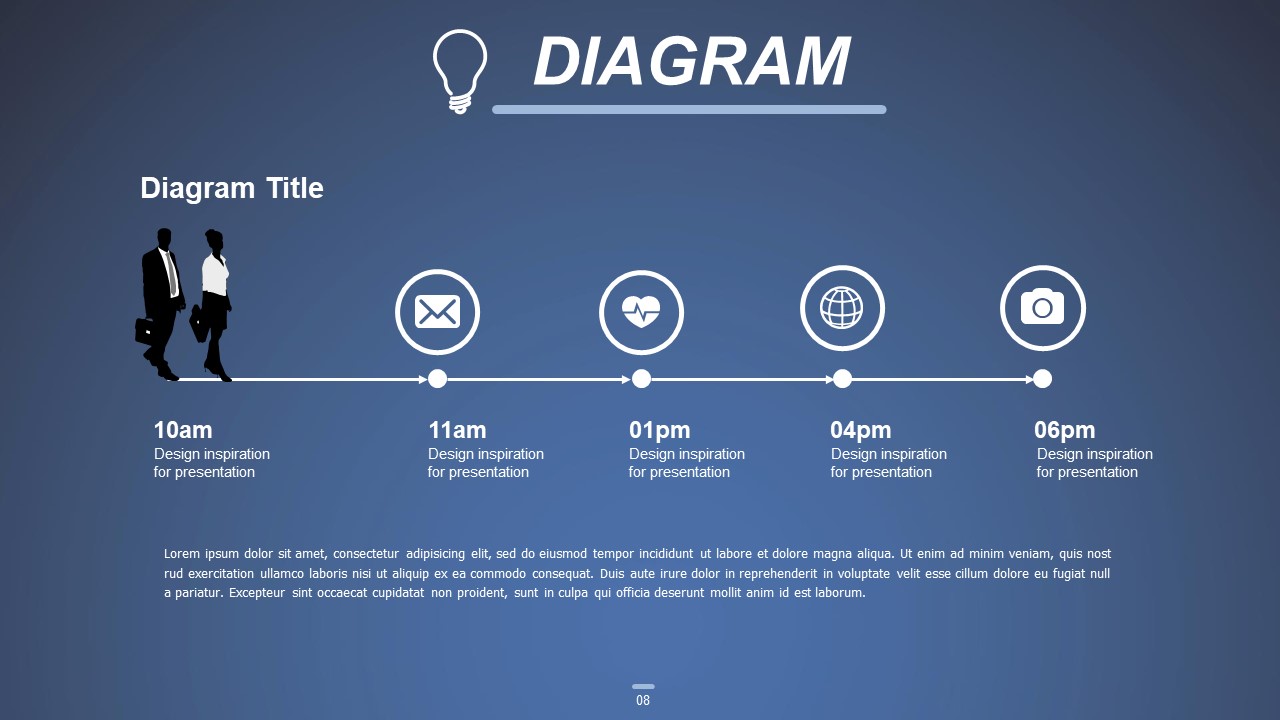
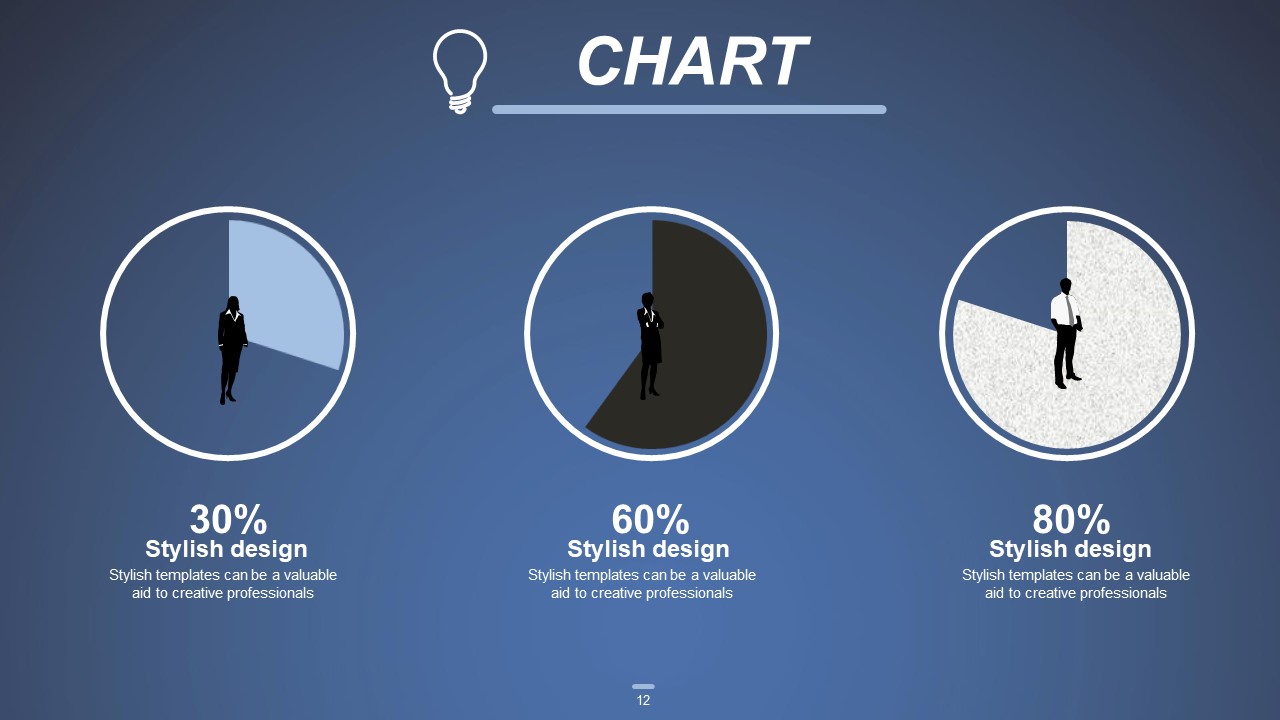
A professional business PowerPoint template built on a deep navy blue background with crisp white typography and blue-gray accent elements. This 20-slide PPTX set covers every slide type you need for a complete corporate presentation: a bold title slide featuring a businessman silhouette, person-icon ratio charts, stacked bar charts, a circular team profile layout, a five-step icon timeline, a line graph for trend data, and a regional map with percentage callouts. The recurring lightbulb icon used as a section divider creates visual consistency across all slides, giving your presentation a cohesive, polished look. All slides are fully editable in PowerPoint—swap in your own text, data, and images without any design experience. The 16:9 widescreen ratio ensures crisp display on large projection screens and virtual meeting platforms alike. Ideal for investor pitches, corporate strategy decks, team introductions, and business performance reports.
Usage Points
-
Main Usage
Designed for corporate presentations, investor meetings, team introductions, and business performance reports. The dark navy theme conveys authority and professionalism across all slide types included in the set.
-
How to Use
Open the PPTX file in PowerPoint, replace the placeholder text, numbers, and images with your own content, and your presentation is ready. Chart data can be updated directly via the linked Excel sheet for quick edits.
-
Recommended For
Best suited for business professionals, sales and strategy teams, startup founders, IR managers, and consultants who need a complete, ready-to-use slide deck for high-stakes presentations.
-
Slide Structure
20 slides including: title slide with businessman image and bold typography, person-icon ratio chart, stacked bar chart (A/B/C comparison), circular team profile slide (CEC/HR/PR), five-step icon timeline (10am–06pm), line trend graph (2005–2014), and regional map with percentage data callouts.
Related Products
-

Multitasking Presentation Template – Optimized Design for Business
#Business
-

Business Partnership PowerPoint Template – Build Trust with Elegant Design
#Business
-

Partnership PowerPoint Template – Ideal for Business Presentations
#Business
-

Finance Presentation Template – Sleek and Modern Design
#Business
