Business Objectives Analysis Table Diagram – Analyze All Business Goals
RJ0300040_7
- Last Update 04/28/2025
- File Size 1.3MB
- # of Slides 2
- File Format PPTX
- Slide Ratio 16:9
- Color
Keywords
- #Content-Based Slides
- #Design-Based Slides
- #Business Vision and Strategy
- #Diagram
- #Business Strategy
- #Business Goals
- #Cluster
- #Table
- #Chain Diagram
- #Standard Table
- #16:9
- #linear diagram PowerPoint
- #3-step process slide
- #business objectives analysis
- #table diagram PowerPoint
- #business process flow slide template
About the Product
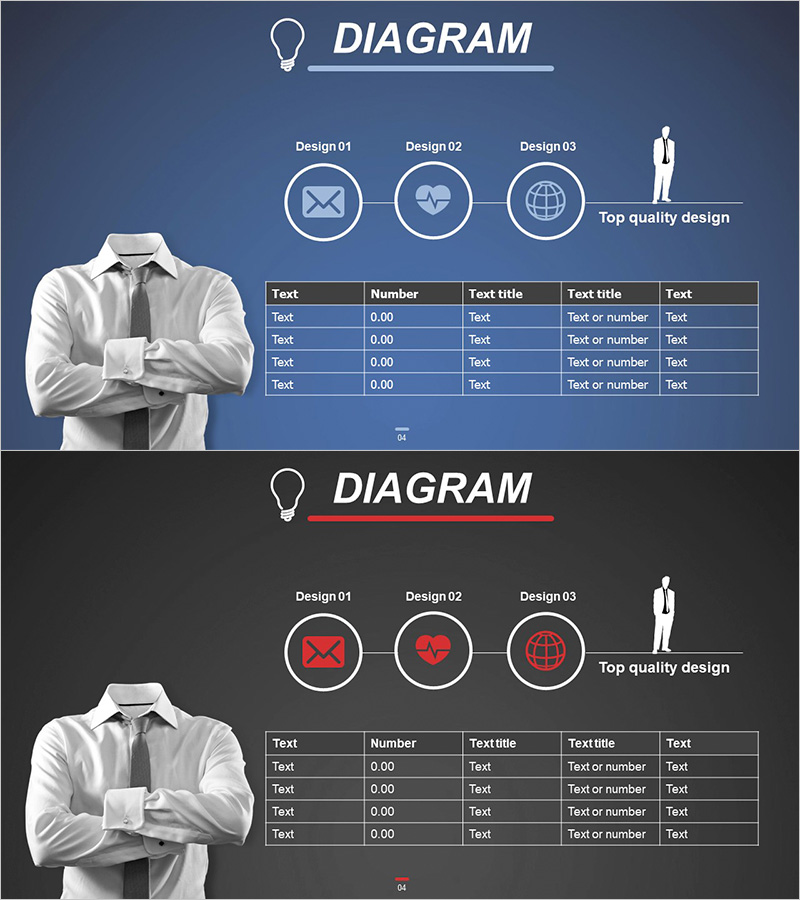
A 3-step linear diagram PowerPoint slide designed for business objective analysis and strategic planning. Built on a dark blue background with white circular nodes connected by horizontal lines, this process flow diagram features distinct icons (envelope, compass, globe) at each stage to visualize business goal progression. The lower section includes a 5-column data table for entering text, numerical values, and descriptions to organize detailed analysis metrics. A professional businessman image on the left and 'Top quality design' text on the right reinforce credibility. The 2-slide set offers color variations (blue and red) for flexible presentation adaptation.
Usage Points
-
Main Usage
This slide simultaneously presents the sequential progression of business objectives and detailed analytical data. The diagram visualizes strategic flow while the table below organizes stage-specific metrics, figures, and descriptions to clearly support decision-making.
-
How to Use
Enter stage names (Design 01, 02, 03) in the three circular nodes at the top. Fill the table columns (Text, Number, Text title) with corresponding stage objectives, metrics, and explanations. Replace the left businessman image with company logo or key message as needed. Use color-variant slides to apply different tones across presentation sections.
-
Recommended For
Ideal for executives, strategy teams, and marketing departments presenting business objectives, strategic planning, and performance analysis. Particularly effective for quarterly goal reviews, new business plan presentations, investor strategy briefings, and organizational goal-alignment meetings.
-
Slide Structure
Top section: 3 circular nodes (approximately 80px diameter each) connected horizontally with icons inside. Bottom section: 5-column × 4-row data table (Text, Number, Text title, Text title, Text columns) for information entry. Left side: professional businessman image (approximately 400px height). Right side: 'Top quality design' text label. 2-slide set includes blue background and red background variations.
Related Products
-

Connected Nested Circle Diagram – Visualizing Business Vision and Strategy
#Business Vision and Strategy #Diagram #Business Strategy
-

Simple & Modern Wide PPT Icons and Text - Business Strategy and Goals
#Business Vision and Strategy #Diagram #Business Strategy
-

Coffee Imprint Diagram – Visualizing Business Strategy
#Business Vision and Strategy #Diagram #Business Strategy
-

Functional Value Proposition Slide – Business Strategy Presentation
#Business Vision and Strategy #Diagram #Business Strategy
