Organizational Chart Network Mind Map Slide
RJ0300040_6
- Last Update 04/28/2025
- File Size 1.2MB
- # of Slides 2
- File Format PPTX
- Slide Ratio 16:9
- Color
Keywords
- #Content-Based Slides
- #Design-Based Slides
- #Company Introduction
- #Technical Approach
- #Diagram
- #Organizational Chart
- #System Architecture Diagram
- #Structure
- #Cluster
- #Tree Diagram
- #Chain Diagram
- #16:9
- #network diagram PowerPoint
- #radial diagram slide template
- #organizational chart presentation
- #central connection structure
- #business diagram template download
About the Product
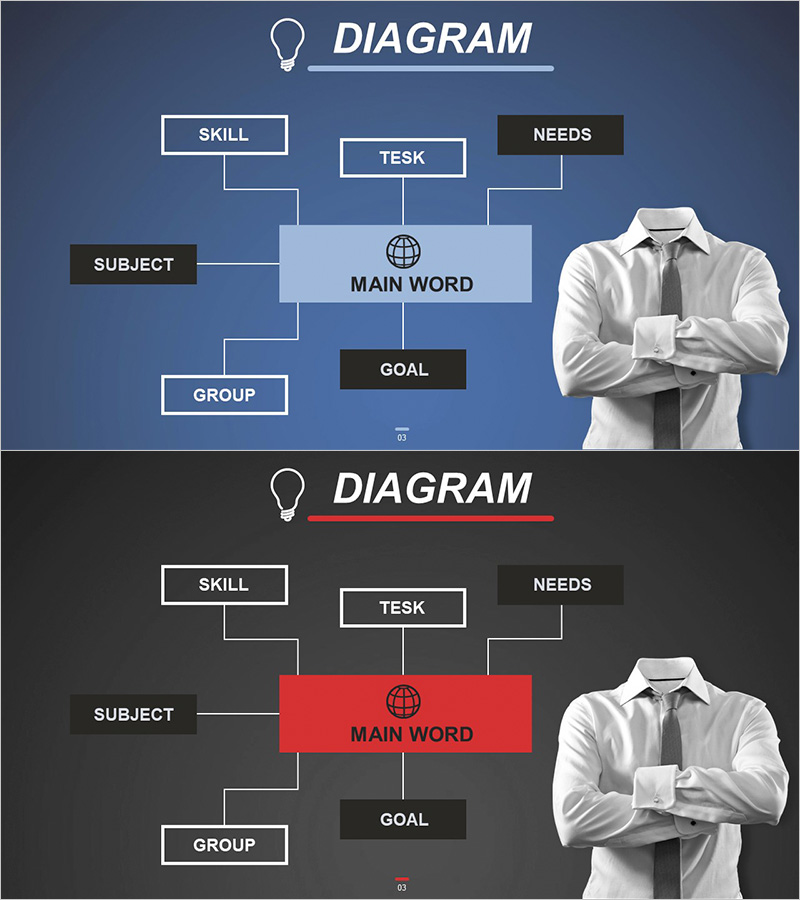
A radial network diagram PowerPoint slide featuring a central hub connected to six surrounding elements in a spoke pattern. The design uses a dark blue background with white-bordered boxes and black accent boxes to establish clear information hierarchy. This presentation slide is ideal for illustrating organizational structures, technology architectures, process flows, and stakeholder relationships in business contexts. The 2-slide set includes a dark blue version and a dark gray version, allowing you to match your presentation environment and brand color scheme.
Usage Points
-
Main Usage
Visually represent organizational hierarchies, centralized technology system architectures, and strategic relationships that branch from a core concept. Effectively communicate complex structures in company introductions, technology department briefings, organizational restructuring proposals, and strategic planning sessions.
-
How to Use
Enter your core concept (company name, system name, strategic objective) in the central 'MAIN WORD' box and populate the six surrounding boxes with supporting elements (departments, technology components, strategic pillars). Freely edit text boxes and connector lines to customize the diagram for your organization size and content requirements.
-
Recommended For
Executive presentations on organizational structure, technology teams explaining system architecture, marketing teams presenting strategy frameworks, HR departments sharing organizational changes, consulting firms pitching business models, and cross-functional teams illustrating stakeholder relationships and dependencies.
-
Slide Structure
2-slide set with color variations: Slide 1 features a dark blue background with light blue central box; Slide 2 uses a dark gray background with red central box. Both slides maintain the same radial structure with one central node connected to six outer nodes via straight connector lines and editable text boxes.
Related Products
-

Business Relationship Diagram for Organizational Visualization – Effective System Structuring
#Company Introduction #Technical Approach #Diagram
-

Business Process Organization Chart – Visualizing Company Structure
#Company Introduction #Technical Approach #Diagram
-

Bank Service Company Organization Chart – Modern and Sleek Structure
#Company Introduction #Diagram #Organizational Chart
-

Modern Simple Organizational Chart Diagram – Clear Visualization of Technical Structure
#Company Introduction #Technical Approach #Diagram
