Business Sector Analysis Chart – Multifaceted Visualization
RJ0300040_16
- Last Update 04/28/2025
- File Size 1.5MB
- # of Slides 2
- File Format PPTX
- Slide Ratio 16:9
- Color
Keywords
- #Content-Based Slides
- #Design-Based Slides
- #Business Introduction
- #Market and Competitor Analysis
- #Diagram
- #Graph
- #Technological Status
- #Market Analysis
- #Cluster
- #Horizontal Bar
- #Chain Diagram
- #Segmented Horizontal Bar
- #16:9
- #horizontal bar chart PowerPoint
- #multi-series comparison slide
- #business analysis chart template
- #year-over-year trend visualization
- #data comparison presentation slide
About the Product
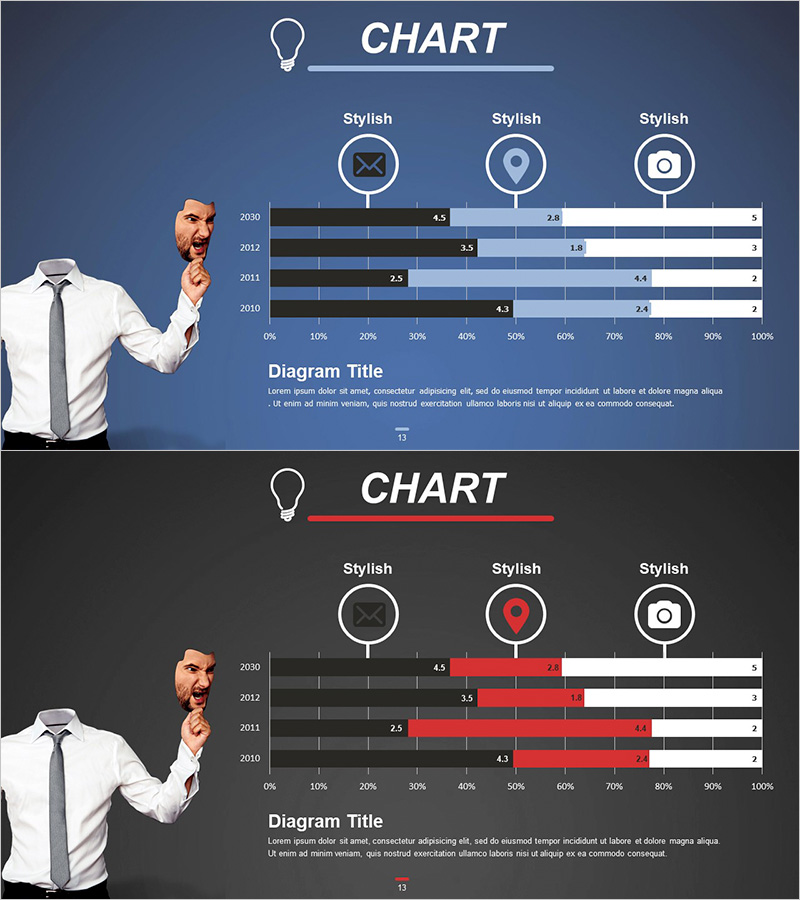
A horizontal bar chart PowerPoint slide for comparing business sector performance across four years (2010–2030) with three data series displayed in dark navy, light blue, and white. This presentation slide features a dark blue background with white typography and three circular icons (envelope, location pin, camera) positioned at the top right. The chart clearly visualizes year-over-year trends and multi-category comparisons, making it ideal for market analysis, competitive benchmarking, and business performance reports. Provided in 16:9 widescreen PPTX format with fully editable elements including data labels, bar colors, and icon placement.
Usage Points
-
Main Usage
Displays year-over-year or category-by-category performance data in horizontal bar format to clearly communicate trend changes and comparative metrics. The 0–100% scale accommodates various business KPIs including revenue, market share, growth rate, and achievement percentage.
-
How to Use
Two slide layouts provided: dark blue background and black background versions. Double-click data labels to replace with actual figures, and modify bar colors using the theme color palette. The three circular icons can be customized or removed to match your category labels or branding requirements.
-
Recommended For
Ideal for executives, marketing teams, strategic planners, and sales teams presenting quarterly or annual performance reviews, market share analysis, competitive positioning, and divisional performance comparisons. Suitable for investor presentations, shareholder meetings, and executive briefings.
-
Slide Structure
Each slide contains a title area (CHART header with accent line), central chart area (4 year rows × 3 data series bars with numeric labels), left-side business professional illustration, and three icon callouts on the right. Includes 0–100% horizontal axis gridlines and implicit legend structure.
Related Products
-

Visualizing Current Internet Shopping Payment Technologies with Horizontal Bar Graph
#Business Introduction #Market and Competitor Analysis #Graph
-

Content Composition Breakdown by Year with Horizontal Bar Chart
#Business Introduction #Market and Competitor Analysis #Graph
-

4-Step Business Process Graph – Market Analysis and Technology Status
#Business Introduction #Market and Competitor Analysis #Graph
-

Target Country Analysis Chart – Data Visualization for Market Analysis
#Market and Competitor Analysis #Graph #Other
