Business Strategy Diagrams & Charts – Example-Centric Market Strategy
RJ0300040_9
- Last Update 04/28/2025
- File Size 1.3MB
- # of Slides 2
- File Format PPTX
- Slide Ratio 16:9
- Color
Keywords
- #Content-Based Slides
- #Design-Based Slides
- #Business Vision and Strategy
- #Marketing Plan and Strategy
- #Diagram
- #Graph
- #Business Strategy
- #Marketing Strategy
- #Flow
- #Column
- #Linear Flow
- #Column Chart
- #16:9
- #circular diagram PowerPoint
- #bar chart presentation
- #business strategy slide
- #data visualization PPT
- #marketing strategy template
- #cycle diagram slide template
About the Product
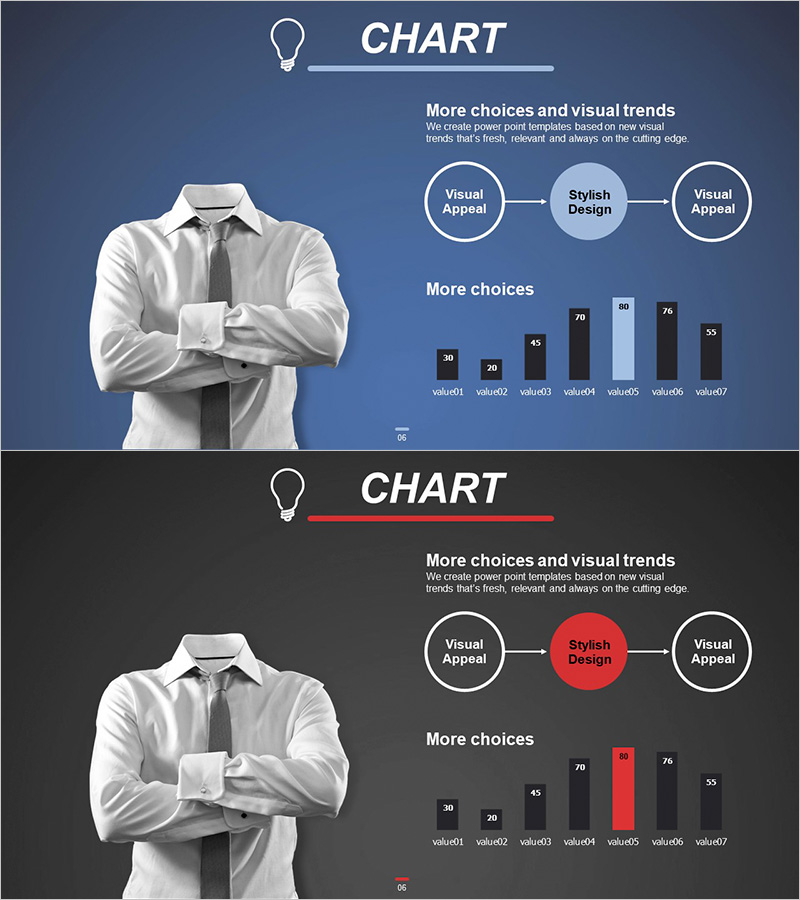
A 2-slide PowerPoint set that visually presents business strategy and market analysis. The first slide features a 3-stage circular diagram showing Visual Appeal → Stylish Design → Visual Appeal flow, clearly expressing the cyclical nature of strategic processes. The second slide displays a 7-item bar chart for comparative data analysis. Dark blue background combined with white text and accent colors (light blue and red) creates a professional presentation. Available in 16:9 widescreen PPTX format, fully editable and ready to use for business strategy presentations, marketing planning, performance reports, and various corporate communications.
Usage Points
-
Main Usage
Simultaneously presents business strategy cycles and quantitative data to executives and team members, clearly communicating strategic direction and performance metrics. The circular diagram visualizes continuous improvement cycles, customer satisfaction loops, and marketing funnels, while the bar chart intuitively displays monthly performance, departmental results, and competitive comparisons.
-
How to Use
Replace node text in the first slide's circular diagram with your strategy stage names, and update the bar chart legend and values with actual data on the second slide. Maintain the dark blue background while customizing accent colors (light blue and red) to match your organization's brand palette. The 16:9 widescreen format is optimized for large-screen presentations.
-
Recommended For
Ideal for quarterly and annual strategy presentations by executives, strategy teams, marketing departments, and sales teams. Suitable for board meetings, investor presentations, team meetings, and educational seminars. Particularly effective when explaining cyclical business models, customer journeys, and product development cycles.
-
Slide Structure
Slide 1: Circular diagram with 1 central node connected to 3 external nodes via bidirectional arrows (dark blue background, white and light blue text). Slide 2: Vertical bar chart with 7 items (value01–value07, heights ranging 30–80, mixed dark blue, light blue, and red colors, with X-axis labels). Full 16:9 aspect ratio, PPTX format.
Related Products
-

Marketing Mix 4P Linear Diagram
#Business Vision and Strategy #Marketing Plan and Strategy #Diagram
-

VR Sales Marketing Strategy PowerPoint Slide – Linear Flow Diagram
#Business Vision and Strategy #Marketing Plan and Strategy #Diagram
-

Step-by-step Marketing Strategy STEP5 – Visualizing Business Strategies
#Business Vision and Strategy #Marketing Plan and Strategy #Diagram
-

Blood Donation Marketing Strategy Diagram – Effective Data Visualization
#Business Vision and Strategy #Marketing Plan and Strategy #Diagram
