Customer Analysis Diagram & Segmentation Graph – In-depth Market Insights
RJ0300040_10
- Last Update 04/28/2025
- File Size 1MB
- # of Slides 2
- File Format PPTX
- Slide Ratio 16:9
- Color
Keywords
- #Content-Based Slides
- #Design-Based Slides
- #Market and Competitor Analysis
- #Graph
- #Customer Analysis
- #Market Analysis
- #Column
- #Other
- #Segmented Column
- #Other Charts
- #16:9
- #customer analysis diagram
- #segmented stacked bar chart PowerPoint
- #market analysis slide template
- #stacked bar graph
- #customer segmentation presentation
About the Product
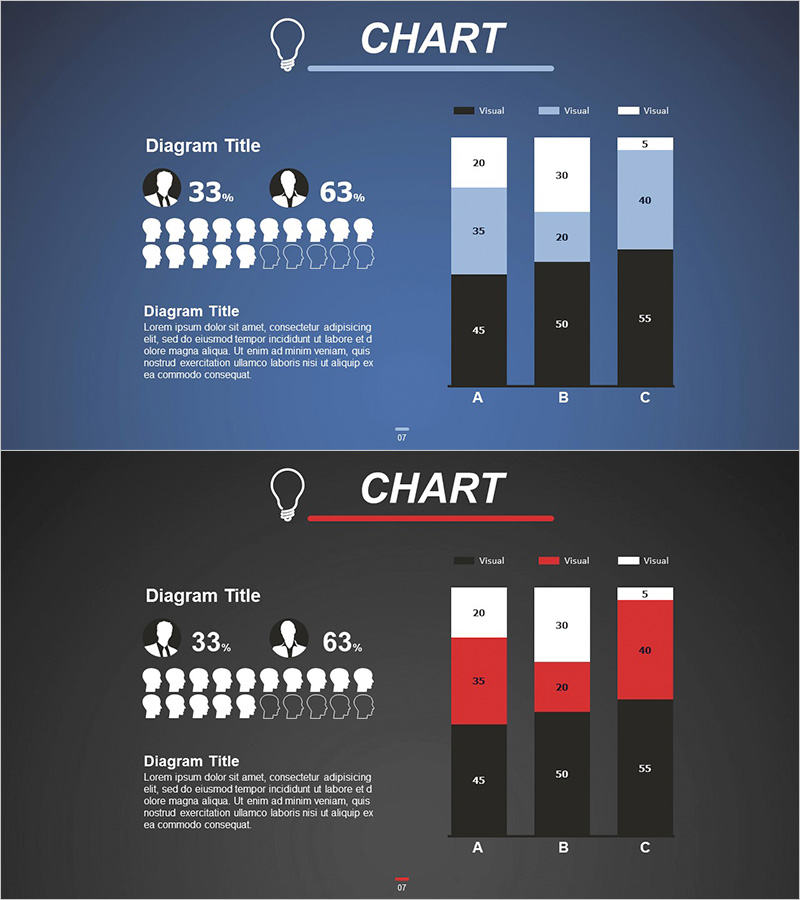
A 2-slide PowerPoint presentation set designed for customer analysis and market segmentation. The first slide features a customer profile diagram combining persona icons with percentage metrics to visually represent target customer characteristics. The second slide displays a segmented stacked bar chart for three items (A, B, C) using a navy-light blue-white color palette to visualize multi-layered data. Each bar is divided into 4-5 segments for comprehensive data comparison, delivered in 16:9 widescreen format. Ready to use immediately for customer segmentation, market analysis, sales performance reviews, and business presentations.
Usage Points
-
Main Usage
Simultaneously present customer profile analysis and market segmentation data. Persona icons visualize customer characteristics while stacked bar charts enable multi-data comparison, clearly communicating complex market insights.
-
How to Use
Introduce key customer segment ratios and characteristics on the first slide, then compare performance metrics (revenue, customer count, satisfaction) by segment on the second slide. Numbers and color differentiation facilitate data interpretation.
-
Recommended For
Marketing managers, sales directors, and executive reports. Ideal for customer analysis, market segmentation, sales performance analysis, and strategic planning meetings requiring data-driven decision support.
-
Slide Structure
Slide 1: Customer profile diagram – 2 primary persona icons (33%, 63%) with 10 additional customer silhouettes for people-based visualization. Slide 2: Segmented stacked bar chart – 3 items (A, B, C) with 4-5 data series (navy, light blue, white, gray) stacked to show comparative composition.
Related Products
-

Medical Services Characteristics Connection Diagram
#Market and Competitor Analysis #Graph #Customer Analysis
-

3D Segmented Bar Graph for Performance Analysis – Market Trends
#Market and Competitor Analysis #Graph #Customer Analysis
-

Smoker Analysis Silhouette & Segmentation Graph – The First Step to Customer Understanding
#Market and Competitor Analysis #Graph #Customer Analysis
-

Customer Analysis Line Graph – Visualizing Market Insights
#Market and Competitor Analysis #Graph #Customer Analysis
