Competitor Analysis Broken Line Graph – Visualizing Market Trends
RJ0300040_13
- Last Update 04/28/2025
- File Size 1MB
- # of Slides 2
- File Format PPTX
- Slide Ratio 16:9
- Color
Keywords
- #Content-Based Slides
- #Design-Based Slides
- #Market and Competitor Analysis
- #Graph
- #Other
- #Competitor Analysis
- #Industry Trends
- #Line
- #Line Chart
- #Silhouette
- #16:9
- #line chart PowerPoint
- #multi-series graph template
- #market trend analysis slide
- #competitor comparison chart
- #trend data visualization
- #business chart download
About the Product
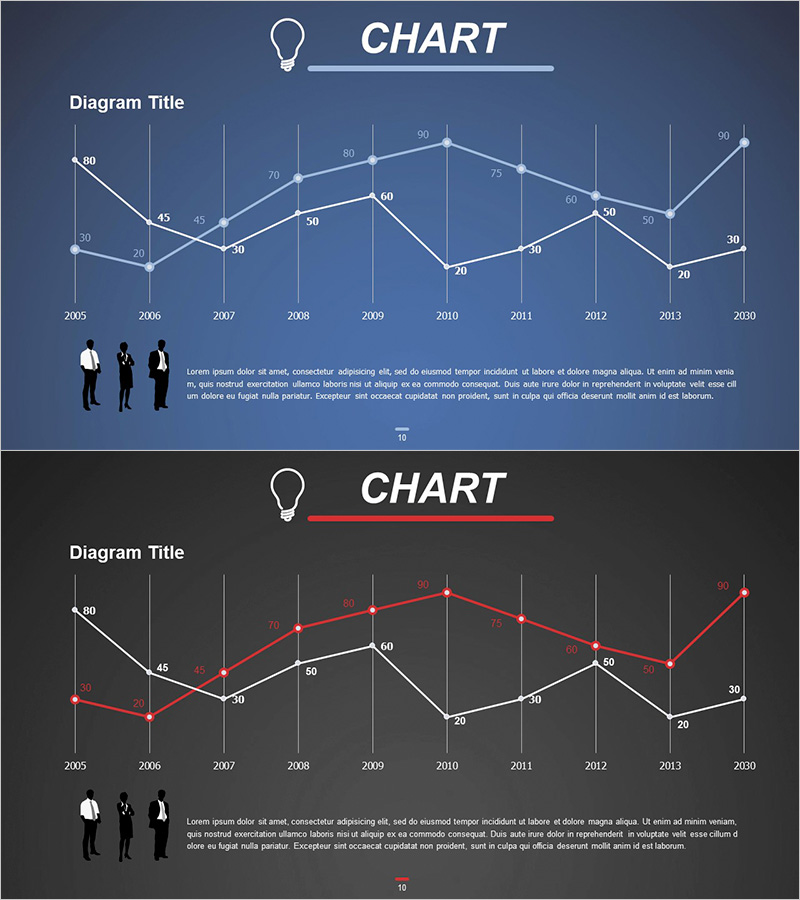
A multi-series line chart PowerPoint slide designed for competitor analysis and market trend visualization. This presentation template displays two data series (blue and red lines) spanning from 2005 to 2030, enabling clear comparison of competitive dynamics over a 25-year period. Vertical gridlines and labeled data points facilitate precise value reading, while silhouettes of business professionals and a text area at the bottom allow for additional insights and commentary. The 16:9 widescreen format with 2-slide composition is ready for immediate use in business presentations and reports.
Usage Points
-
Main Usage
Optimized for expressing two or more data series over extended time periods, such as competitor analysis, market trend progression, and performance comparisons. The intersection points and rising/falling segments of the line chart intuitively communicate competitive positioning and market shifts.
-
How to Use
Use in business reports, investor presentations, marketing strategy briefings, and executive updates to explain market position and competitive landscape. Replace data points and labels with your actual figures, and customize the legend and axis titles to match your presentation context.
-
Recommended For
Recommended for strategy planners, marketing professionals, executives, consultants, and analysts who need to explain data-driven decision-making. Particularly suitable for presentations requiring competitive analysis, market share trends, and performance comparisons.
-
Slide Structure
2-slide composition. Each slide features a dual-series line chart (blue and red), 10 time intervals (2005–2030), vertical gridlines, labeled data points (range 20–90), three business professional silhouettes at the bottom, and a text area for additional commentary.
Related Products
-

Competitive Market Trend Analysis Graph – Visualizing Market Trends
#Market and Competitor Analysis #Graph #Competitor Analysis
-

Market Trend Analysis Graph & Table Chart – Insightful Data Visualization
#Market and Competitor Analysis #Diagram #Graph
-

Modern Business Presentation Template Line Chart
#Business Strategy #Market and Competitor Analysis #Graph
-

Typographic Wide Template Line Chart – Effective Data Visualization for Market Analysis
#Market and Competitor Analysis #Diagram #Graph
