US Target Market Map for Marketing Analysis
RJ0300040_17
- Last Update 04/28/2025
- File Size 1.4MB
- # of Slides 2
- File Format PPTX
- Slide Ratio 16:9
- Color
Keywords
- #Content-Based Slides
- #Design-Based Slides
- #Market and Competitor Analysis
- #Marketing Plan and Strategy
- #Graph
- #Other
- #Target Market
- #Target Market Strategy
- #Other
- #Other Charts
- #Map
- #16:9
- #US map PowerPoint slide
- #regional data visualization template
- #geographic chart presentation
- #market analysis map slide
- #regional percentage comparison
- #how to create US map in PowerPoint
About the Product
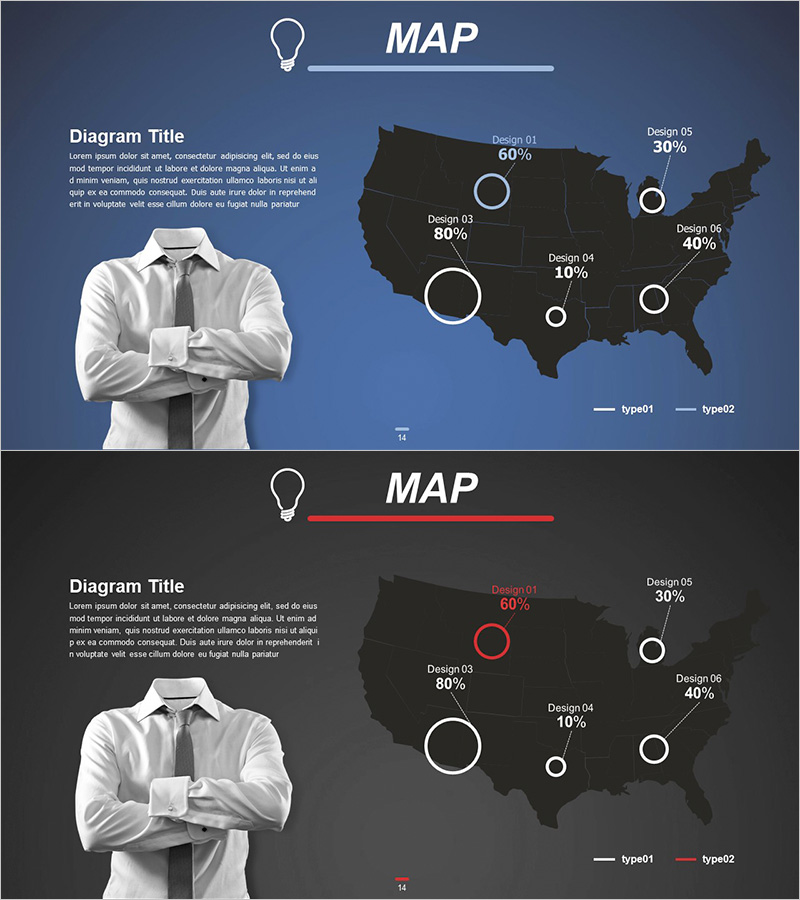
A geographic PowerPoint slide that divides the United States into 6 regions and displays regional data metrics using circular node charts overlaid on the map. The dark-background US map features white and red circular indicators positioned at each region, enabling clear comparison of market share, sales volume, customer distribution, and regional performance at a glance. Provided in 2 color themes (blue-toned dark background + red accent), with fully editable regional percentages for immediate use in marketing analysis presentations, sales reports, and regional strategy briefings. The 16:9 widescreen 2-slide set is optimized for the market analysis section of business presentations.
Usage Points
-
Main Usage
Visualizes US regional market data, sales performance, and customer distribution on a geographic map to enable clear regional comparison analysis. Each region's metrics are represented by circular node size and percentage labels, making relative proportions immediately intuitive.
-
How to Use
Insert into the market analysis section of marketing plans, regional performance slides in sales reports, and geographic expansion strategy sections of business plans. Double-click regional nodes to edit percentages directly, and select color themes to match your presentation tone.
-
Recommended For
Marketing managers, sales directors, business development teams, regional strategy planners, and executives presenting to stakeholders. Ideal for B2B and B2C companies targeting the US market during quarterly and annual performance reviews, regional strategy meetings, and investor presentations.
-
Slide Structure
Slide 1: Blue-toned background with dark US map and 6 white circular nodes (60%, 80%, 10%, 40%, 30%, 40%) with legend (type01, type02). Slide 2: Black background with dark US map and 6 white and red circular nodes (same percentages) with red accent legend. All nodes are text-editable and size-adjustable for custom percentage representation.
Related Products
-

Dot Map Graph for Market Analysis Visualization – Strategic Approach
#Market and Competitor Analysis #Marketing Plan and Strategy #Graph
-

Target Country Distribution Graph – Strategic Visualization for Market Analysis
#Market and Competitor Analysis #Marketing Plan and Strategy #Graph
-

Target Market Share Map Graph – Market Analysis and Strategy
#Market and Competitor Analysis #Marketing Plan and Strategy #Graph
-

European Target Country Analysis Graph – Insightful Marketing Strategy
#Market and Competitor Analysis #Marketing Plan and Strategy #Graph
