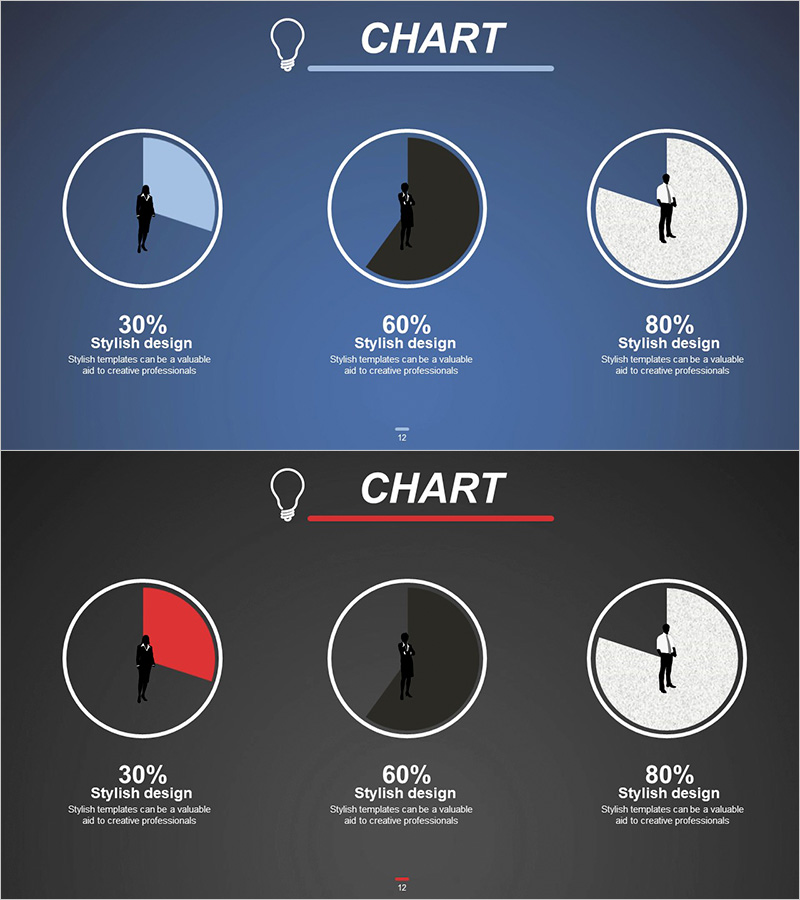
Silhouette Development Status Pie Graph
RJ0300040_15
- Last Update 04/28/2025
- File Size 0.9MB
- # of Slides 2
- File Format PPTX
- Slide Ratio 16:9
- Color
Keywords
About the Product
Visualize three different ratio data—development status, market share, and project progress—in a single free PowerPoint slide. This slide features silhouette illustrations combined with a professional yet modern aesthetic, available in both blue and dark backgrounds to match any presentation context. Simply replace the percentage, title, and description text for each pie chart to instantly use it in business plans, reports, proposals, investor pitches, and marketing presentations. Download for free and customize in PowerPoint to suit your needs. Explore more graph slide collections on GoodPello for additional visualization options.
Usage Points
-
Main Usage
Display three different ratio data simultaneously—such as development status, market share, or project progress—to communicate information clearly to your audience.
-
How to Use
Replace the percentage, title, and description text under each pie chart with your own data, then select the background color (blue or dark) that matches your presentation context.
-
Recommended For
Ideal for business plans, reports, proposals, investor presentations, marketing plans, and any business presentation requiring ratio data emphasis.
-
Slide Structure
Single-slide layout featuring three pie charts with silhouette illustrations, each containing three text areas for percentage, title, and description.
Related Products
-

Market Analysis Graph – Harmony of Pink and Bluegreen
#Free Graphs
-

Competitive Advantage Analysis Bar Chart – Data Visualization
#Free Graphs
-

Business Comparison Analysis Graph – Strengthening Market and Competitor Analysis
#Free Graphs
-

Data Visualization with Bar Charts – Presentation for Efficient Choices
#Free Graphs
