Advancement Presentation Template – Business-Optimized Design
J0300036
- Last Update 01/06/2025
- File Size 7.9MB
- # of Slides 20
- File Format PPTX
- Slide Ratio 16:9
- Color
Slide Preview


Keywords
About the Product
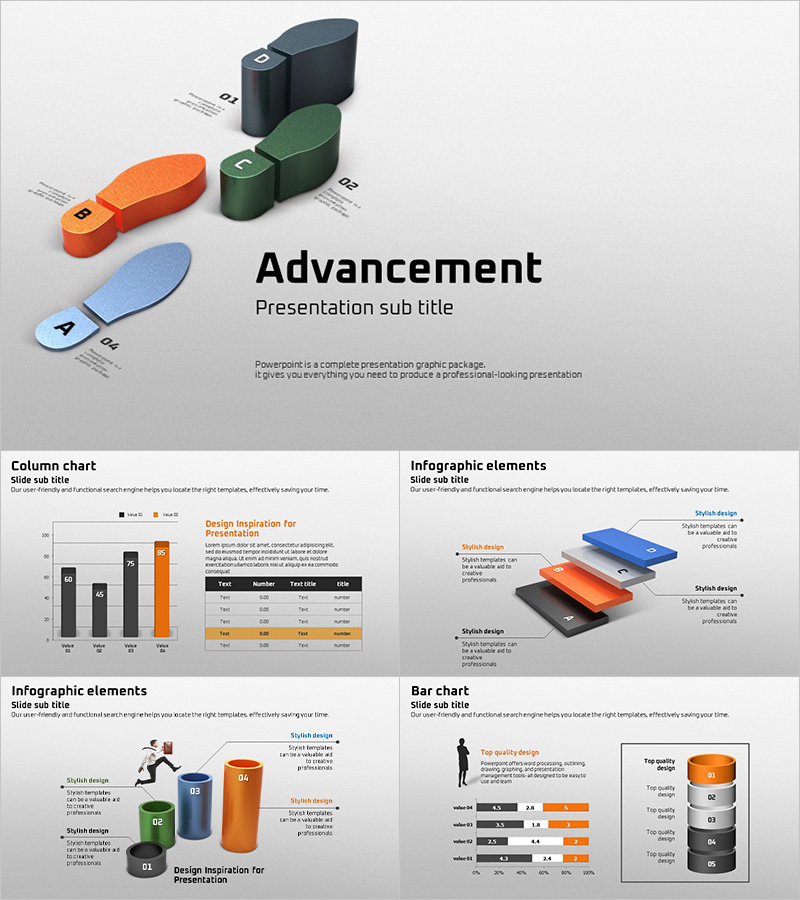
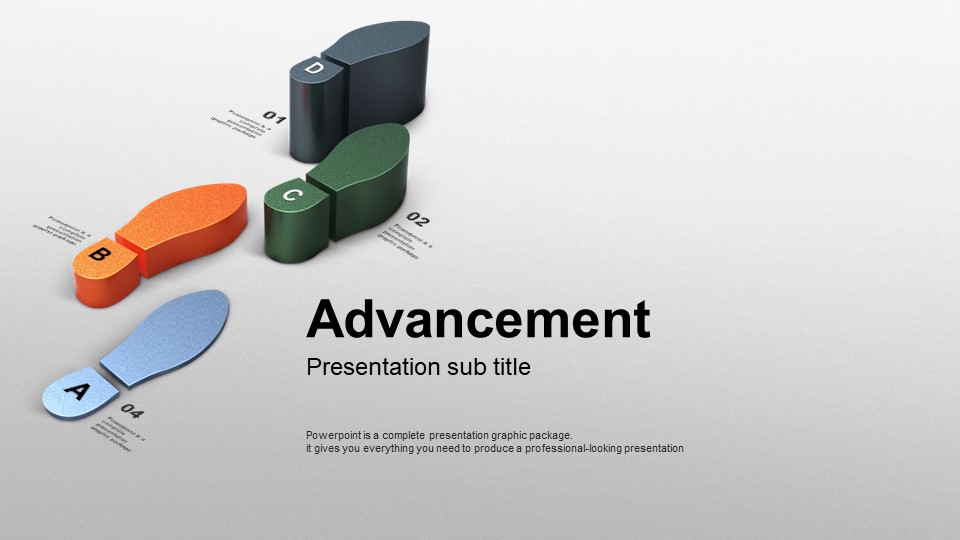
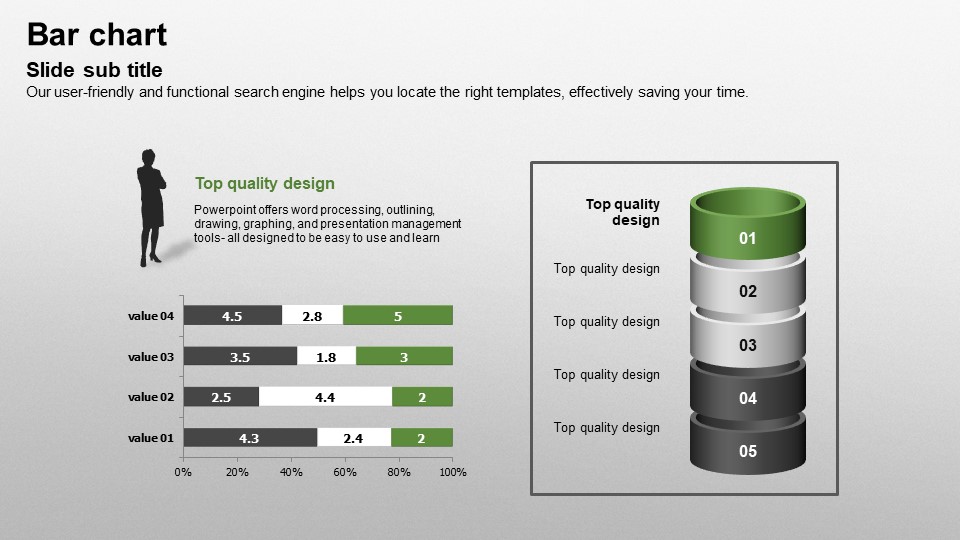
A business PowerPoint template featuring bold 3D objects in orange, dark green, blue, and charcoal gray on a light gray background. This 20-slide presentation deck includes a 4-step advancement diagram with shoe-sole-shaped 3D elements, a 5-step cylindrical infographic, stacked block ratio visuals, column charts, and bar charts — all designed for data-driven business storytelling. Each slide is fully editable in PPTX format, allowing you to customize text, figures, and colors to match your brand. Ideal for investor meetings, executive reports, and strategic planning presentations, this PowerPoint template helps you deliver complex business data with visual clarity and professional impact. Whether you need to show growth stages, compare performance metrics, or map out a strategic roadmap, these slides give your presentation a structured and compelling look.
Usage Points
-
Main Usage
Designed for presenting business growth strategies, performance comparisons, and execution roadmaps. Best suited for investor pitches, executive briefings, and strategic planning sessions where data visualization is essential.
-
How to Use
Download the PPTX file and open it directly in PowerPoint. Replace placeholder text and figures with your own data, adjust colors to match your brand identity, and reorder slides to fit your presentation flow. All 3D objects and chart elements are individually editable.
-
Recommended For
Recommended for business strategists, management consultants, startup founders, and marketing managers who need to present data-driven insights, phased execution plans, or growth milestones in a visually compelling format.
-
Slide Structure
Includes a title slide with a 4-step 3D advancement diagram, column chart with data table, 5-step cylindrical infographic, stacked block ratio visualization, and bar chart with 3D cylinder comparison — 20 slides total focused on data storytelling.
Related Products
-

Business Partnership PowerPoint Template – Build Trust with Elegant Design
#Business
-

Success PowerPoint Wide Design – Professional and Modern Business Template
#Business
-

Ideas Conference Presentation Template – Stylish Business Design
#Business
-

Entertainment Company Presentation Template – Stylish and Colorful Design
#Business
