Gender Ratio Customer Analysis 3D Circle Graph – Insights for Market Understanding
RJ0300036_16
- Last Update 04/27/2025
- File Size 1.2MB
- # of Slides 2
- File Format PPTX
- Slide Ratio 16:9
- Color
Keywords
- #Content-Based Slides
- #Design-Based Slides
- #Market and Competitor Analysis
- #Graph
- #Other
- #Customer Analysis
- #Market Analysis
- #Circles
- #Pie Chart
- #Silhouette
- #16:9
- #pie chart PowerPoint slide
- #3D circle graph template
- #customer analysis chart
- #gender ratio visualization
- #data visualization slide
- #percentage distribution graph
About the Product
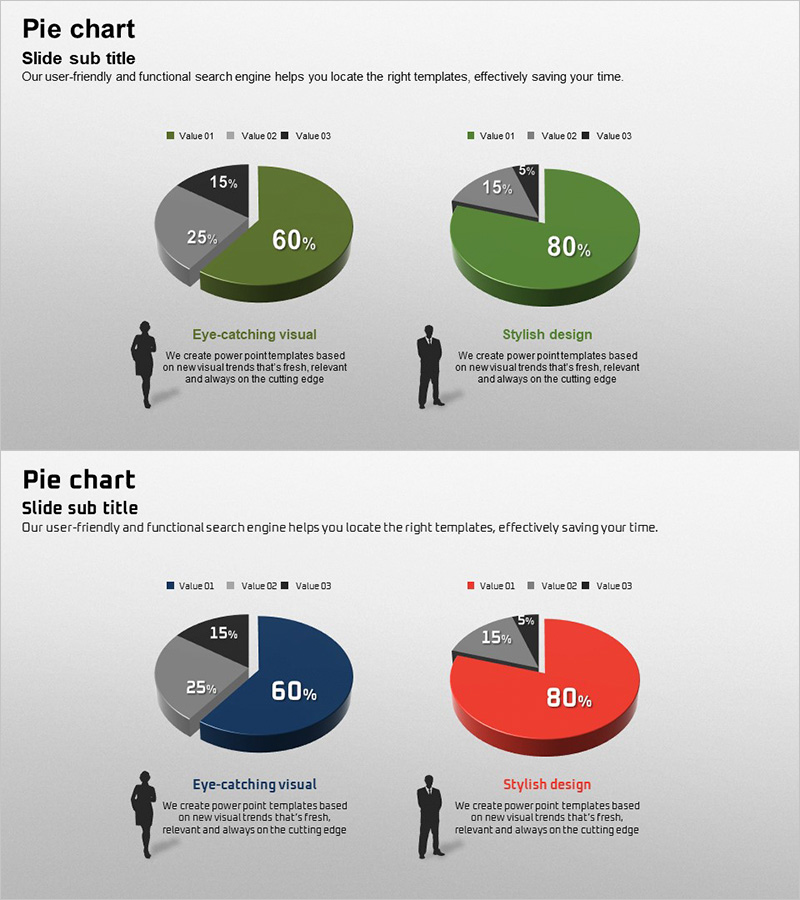
A 3D pie chart PowerPoint slide for gender ratio and customer analysis. This presentation template features three-segment pie charts in green, blue, and red color schemes, with percentage values clearly displayed for intuitive data visualization. The 2-slide set offers multiple color variations, making it ideal for market analysis, customer segmentation, demographic distribution analysis, and business presentations. Delivered as an editable PPTX file in 16:9 widescreen format, allowing you to customize data values and legends to match your specific business needs.
Usage Points
-
Main Usage
Visualize customer composition ratios, gender distribution, and market segmentation data through 3D pie charts to support decision-making by executives, marketing teams, and sales departments. Clear percentage values and legends enable stakeholders to grasp complex data at a glance.
-
How to Use
Use in market analysis presentations, customer segmentation reports, demographic composition analysis, marketing strategy meetings, and quarterly customer status reports. Simply modify the data values and colors in each slide to match your organization's specific metrics and branding requirements.
-
Recommended For
Marketing managers, sales directors, executives, market analysts, business consultants, and data analysis teams presenting customer composition, market conditions, and demographic distribution. Particularly suited for organizations requiring data-driven decision-making and quantitative reporting.
-
Slide Structure
2-slide set with one 3-segment pie chart per slide. First slide features green color scheme (60%-25%-15%), second slide blue scheme (60%-25%-15%), third slide red scheme (80%-5%-15%). Each chart includes descriptive text area below for context and explanation.
Related Products
-

Comparative Chart of Male and Female Professionals
#Market and Competitor Analysis #Graph #Other
-

Space Industry Analysis Graph Chart – Market and Competitive Analysis
#Market and Competitor Analysis #Graph #Customer Analysis
-

Analysis Graph by Job Field – Market and Competition Overview
#Market and Competitor Analysis #Graph #Other
-

User Analysis Donut Chart – Optimal for Market and Competitor Analysis
#Market and Competitor Analysis #Graph #Other
