Diagram Slide for Successful Business – Trust and Collaboration
RJ0300036_6
- Last Update 04/27/2025
- File Size 1.7MB
- # of Slides 2
- File Format PPTX
- Slide Ratio 16:9
- Color
Keywords
About the Product
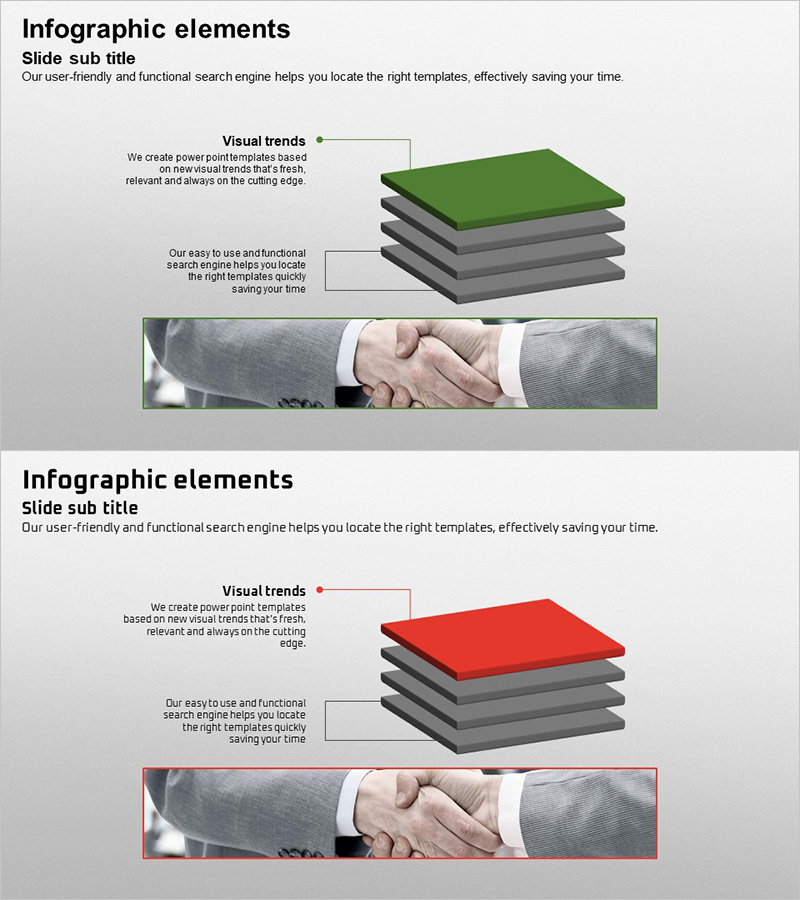
A three-level connection diagram PowerPoint slide designed to visualize trust and collaboration relationships for business success. The green-toned hierarchical structure clearly expresses organizational partnerships, collaboration flows, and stakeholder networks. Available in 2-slide PPTX format with 16:9 aspect ratio, ready for immediate editing and integration into company profiles, strategy presentations, and partner introductions. Clearly defined text input areas enable effective communication of key messages and relationship structures.
Usage Points
-
Main Usage
Optimized for expressing organizational partnerships, collaboration flows, and stakeholder networks in a hierarchical format. Visually emphasizes trust-based business relationships and transforms complex relationship structures into clear, understandable diagrams.
-
How to Use
Apply to company profile sections covering partners and collaborators, strategy presentation segments explaining ecosystem and network composition, and investor pitch decks mapping stakeholder relationships. Customize each level's text boxes with organization names, roles, and functions to create tailored relationship diagrams.
-
Recommended For
Ideal for executives, strategy teams, marketing teams, and sales teams presenting collaboration structures and networks. Particularly effective for B2B business model presentations, ecosystem development strategies, and partnership initiatives.
-
Slide Structure
Three-level hierarchical connection structure with top, middle, and bottom nodes linked by vertical connection lines. Green-toned top node, gray middle tier, and image area at bottom create clear information flow. Both slides maintain identical structure for consistent presentation delivery.
Related Products
-

Diagram Slide Introducing Essential Travel Items
#Product/Service Introduction #Diagram #Features
-

Analysis of Human Response to the Vaccine – Insights into Health
#Product/Service Introduction #Diagram #Features
-

New Drug Ingredient Analysis Diagram – Conveying Trust Through Visuals
#Product/Service Introduction #Diagram #Features
-

Decoding the 3 Embedded Keywords - Concept Visualization through Diagram
#Product/Service Introduction #Technical Approach #Diagram
