Customer Analysis Segmentation Bar Graph – Foundations of Market Analysis
RJ0300036_17
- Last Update 04/27/2025
- File Size 1.2MB
- # of Slides 2
- File Format PPTX
- Slide Ratio 16:9
- Color
Keywords
- #Content-Based Slides
- #Design-Based Slides
- #Market and Competitor Analysis
- #Graph
- #Market Analysis
- #Horizontal Bar
- #Segmented Horizontal Bar
- #16:9
- #segmented bar chart PowerPoint
- #customer analysis slide
- #market analysis presentation
- #data visualization PPT
- #horizontal bar graph template
- #business presentation slides
About the Product
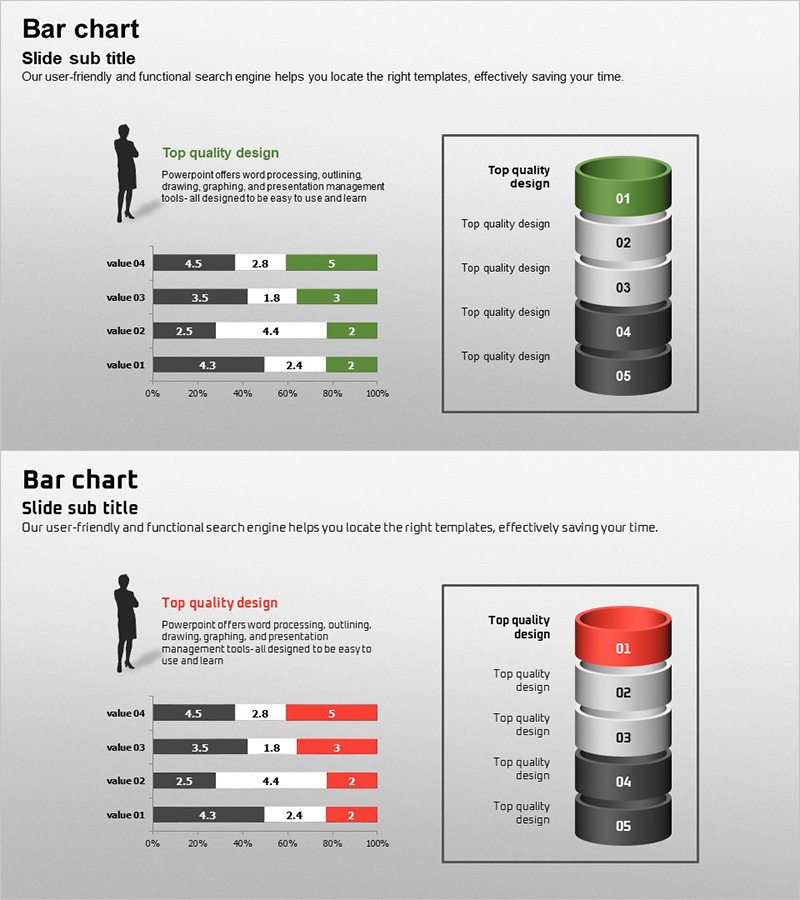
A segmented bar chart PowerPoint slide optimized for customer analysis and market research presentations. This slide visualizes four data series using horizontal bars to enable intuitive comparison across customer segments. The data series are color-coded in dark gray, green, and red for clear differentiation in business presentations. On the right side, a five-tier cylindrical stack diagram represents hierarchical structure, while a silhouette illustration on the left reinforces the presentation context. Fully editable in PowerPoint format—simply input your data and the slide is ready to use immediately.
Usage Points
-
Main Usage
This slide compares customer segment data across four series using horizontal bars and simultaneously displays hierarchical structure through a five-tier cylindrical stack diagram. Ideal for market analysis, customer segmentation, sales performance comparison, and any presentation requiring multi-series data visualization.
-
How to Use
Enter customer segment names and numerical data into the left horizontal bar chart, then add hierarchical information to the right cylindrical stack diagram. Color series (dark gray, green, red) automatically distinguish data categories. The left silhouette illustration reinforces the customer analysis context during presentation.
-
Recommended For
Marketing managers, sales analysts, business executives, market research specialists, and management consultants presenting customer segmentation strategies, market share analysis, sales channel performance comparisons, and competitive positioning.
-
Slide Structure
Two-slide layout. Slide 1: Title and description area / Slide 2: Left side features a 4-series horizontal bar chart (values 01–04, 0–100% scale); right side displays a 5-tier cylindrical stack diagram (labels 01–05). Provided in 16:9 widescreen format with fully editable PPTX elements.
Related Products
-

Segmented Bar Graph for Market Analysis Visualization
#Market and Competitor Analysis #Graph #Market Analysis
-

Blue Orange Segmentation Graph – Market and Competitor Analysis
#Market and Competitor Analysis #Graph #Competitor Analysis
-

Market Entry Potential and Expansion Strategy Chart
#Market and Competitor Analysis #Graph #Market Status
-

Quarterly Furniture Sales Figures Chart – Analysis and Performance
#Market and Competitor Analysis #Financial Plans and Performance #Graph
