Market Analysis Graphs & Tables – Visualizing Sales Growth
RJ0300036_5
- Last Update 04/27/2025
- File Size 1.3MB
- # of Slides 2
- File Format PPTX
- Slide Ratio 16:9
- Color
Keywords
- #Content-Based Slides
- #Design-Based Slides
- #Market and Competitor Analysis
- #Financial Plans and Performance
- #Diagram
- #Graph
- #Market Analysis
- #Sales and Revenue
- #Table
- #Column
- #Standard Table
- #Column Chart
- #16:9
- #column chart PowerPoint slide
- #vertical bar graph template
- #data table slide
- #sales comparison chart
- #market analysis PowerPoint
- #financial data visualization
About the Product
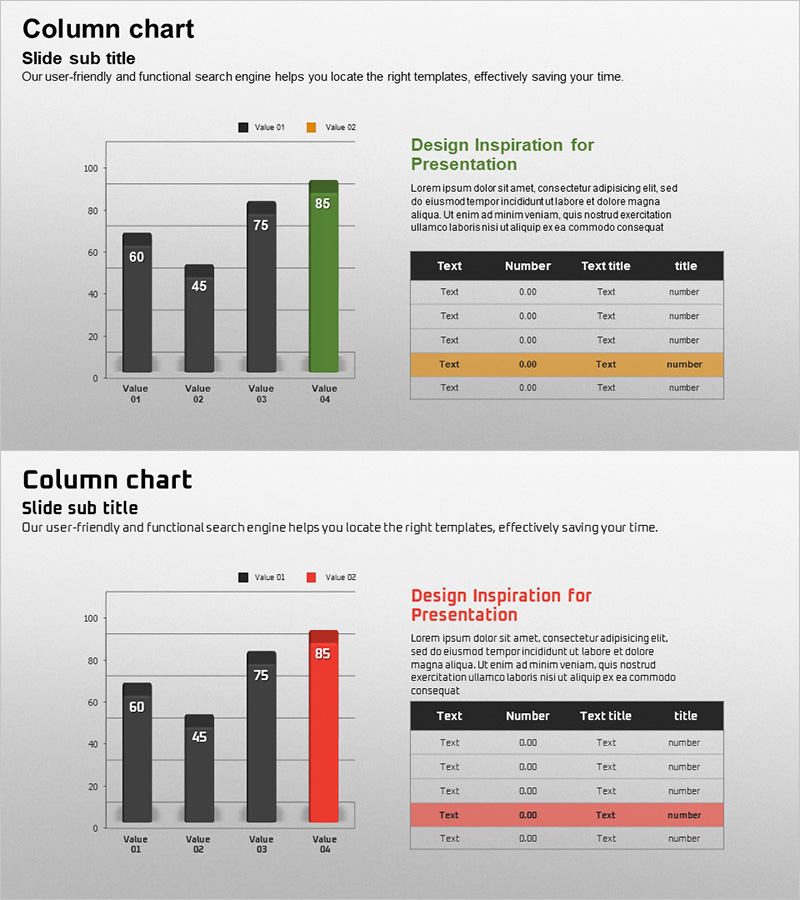
A 2-slide PowerPoint presentation designed for market analysis and financial performance visualization. The first slide displays a vertical column chart comparing four data points across two series in black and orange color schemes. The second slide presents the same data in a structured table format for precise numerical reference. Available in 16:9 widescreen PPTX format with fully editable elements, ideal for quarterly revenue reports, market share analysis, growth rate comparisons, and business performance presentations.
Usage Points
-
Main Usage
Present quantitative business data in market analysis reports, quarterly earnings calls, and financial performance reviews. The column chart enables quick visual comparison of values across categories, while the accompanying table provides exact figures for stakeholder verification and detailed discussion.
-
How to Use
Input actual data values into the column chart; heights adjust automatically. Update axis labels and legend text to match your data categories and units. Replicate the same data in the table cells on slide 2 to maintain consistency across visual and tabular representations throughout your presentation.
-
Recommended For
Finance and accounting professionals preparing quarterly or annual reports, marketing teams analyzing market performance metrics, business analysts presenting competitive benchmarks, executives delivering investor relations presentations, and project managers tracking KPI progress across multiple periods.
-
Slide Structure
Slide 1: Vertical column chart (4 categories × 2 data series) with legend, title, and subtitle areas. Slide 2: 5-row × 4-column data table with black header row and alternating white/orange data rows, plus title and description text zones. 16:9 aspect ratio, fully editable PPTX format.
Related Products
-

Visualizing Business Strategies with Tables & Charts – Clear Data Presentation
#Business Strategy #Financial Plans and Performance #Diagram
-

Sales and Profit Table – Visualizing Financial Performance
#Market and Competitor Analysis #Financial Plans and Performance #Diagram
-

Color-highlighted Bar Graphs and Tables – Optimized for Financial Analysis
#Financial Plans and Performance #Diagram #Graph
-

Blue Red Analysis Chart – New Insights into Market Analysis
#Market and Competitor Analysis #Diagram #Graph
