Segmented Square 3D Graph: Market & Competitive Analysis
RJ0300036_11
- Last Update 04/27/2025
- File Size 1.1MB
- # of Slides 2
- File Format PPTX
- Slide Ratio 16:9
- Color
Keywords
- #Content-Based Slides
- #Design-Based Slides
- #Market and Competitor Analysis
- #Graph
- #Other
- #Competitor Analysis
- #Market Analysis
- #Other
- #Other Charts
- #16:9
- #3D chart PowerPoint
- #segmented box chart
- #market analysis slide template
- #competitive analysis graph
- #business data visualization
- #comparison chart PPT
About the Product
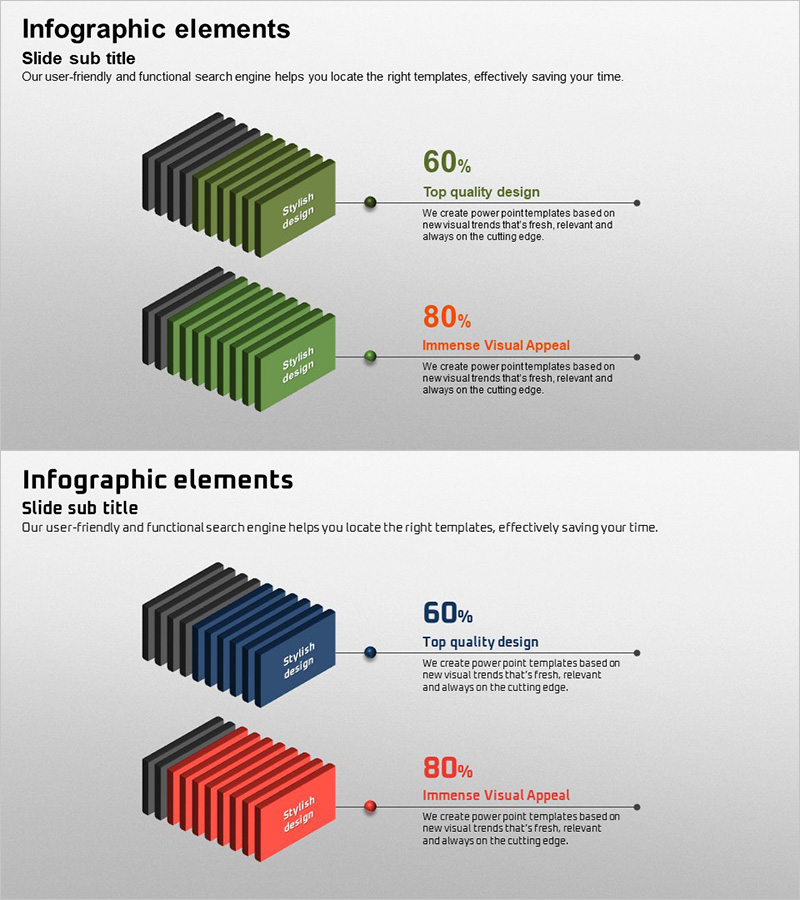
A 3D segmented box chart PowerPoint slide designed for market and competitive analysis presentations. The design features a layered structure with black base boxes highlighted in green, blue, and red across three-tier segments, enabling intuitive visualization of complex data. Each segment functions as an independent data area with percentage values and descriptive text positioned alongside. The 2-slide set is ready for immediate use in market share analysis, competitive positioning, and product comparison scenarios. Delivered in 16:9 widescreen PPTX format, fully compatible with all presentation environments and easily editable for your business data.
Usage Points
-
Main Usage
Visualizes market share, competitive positioning, and product comparison data using a 3D segmented box structure. Each box segment serves as an independent data field, combining percentage values and descriptive text to clearly communicate business insights and strategic positioning.
-
How to Use
Apply in strategy presentations, business planning, and investor pitch decks to explain market conditions, competitive landscape, and product positioning. Customize segment colors, percentages, and text labels to match your data, and adjust slide backgrounds and fonts to align with corporate branding guidelines.
-
Recommended For
Ideal for executives, strategy teams, marketing departments, and sales teams presenting market analysis, competitive strategy, and product value to stakeholders, investors, and clients. Particularly effective for reports, proposals, and investor relations materials requiring clear, intuitive data representation.
-
Slide Structure
2-slide set, each featuring one 3D segmented box chart. First slide emphasizes green highlights; second slide features blue and red variations for design flexibility. Each box displays a three-tier hierarchical structure (black base layer with color-highlighted segments). Percentage values and descriptive text fields are positioned to the right of each chart for easy customization.
Related Products
-

White Black Area Graph – Visualizing Market Analysis
#Market and Competitor Analysis #Graph #Other
-

Country Analysis Map Graph for Market Insights
#Market and Competitor Analysis #Marketing Plan and Strategy #Graph
-

Office Supplies Theme Area Graph – Market Analysis and Competitor Comparison
#Market and Competitor Analysis #Graph #Other
-

Analysis of US Target Regions – Slide Template for Market and Competitor Analysis
#Market and Competitor Analysis #Graph #Other
