Analysis Graph by Job Field – Market and Competition Overview
RJ0300036_4
- Last Update 04/27/2025
- File Size 1.2MB
- # of Slides 2
- File Format PPTX
- Slide Ratio 16:9
- Color
Keywords
About the Product
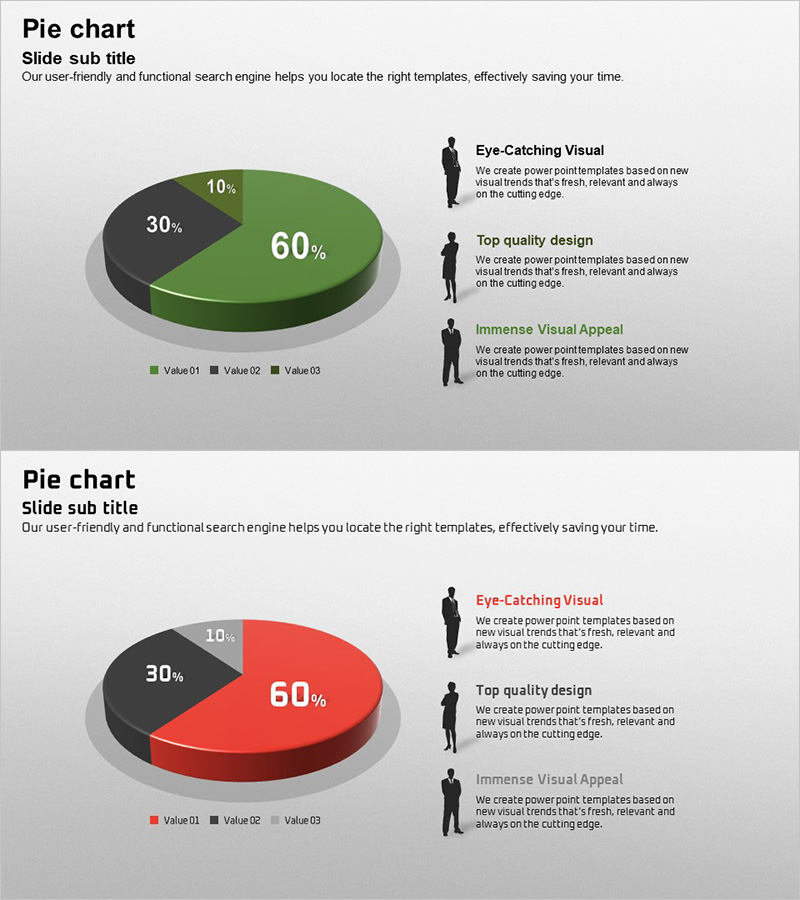
A professional pie chart PowerPoint slide optimized for job field and market analysis presentations. The slide features a 3-segment pie chart with green, red, and gray color schemes representing proportional data, complemented by silhouette icons and descriptive text on the right side to clarify each category's meaning. The 2-slide template offers multiple color variations (green emphasis, red emphasis, and green baseline) allowing you to select the best match for your presentation context. Ideal for market overview, competitive analysis, and job distribution data visualization that requires immediate deployment.
Usage Points
-
Main Usage
Visualize proportional data across three categories such as job field market share, competitor comparison, or customer composition breakdown. The pie chart segments are distinguished by clear color coding, while silhouette icons on the right symbolize each category, enhancing audience comprehension and engagement.
-
How to Use
Deploy in business plan market analysis sections, quarterly performance reports showing ratio breakdowns, and investor pitch decks presenting competitive landscape. Simply edit the pie chart percentages and legend with your data, then customize the right-side text descriptions to match each category's characteristics for immediate use.
-
Recommended For
Marketing managers, business strategists, financial analysts, and consultants who need to communicate data-driven insights. Particularly effective for B2B proposals, executive reports, and academic presentations where clear ratio communication is essential.
-
Slide Structure
Slide 1: Green-emphasized 3-segment pie chart (60%-30%-10%) with three silhouette icons and text description boxes on the right. Slide 2: Red-emphasized version with identical layout. 16:9 widescreen format with left-aligned chart and right-aligned descriptions creating a two-column information hierarchy.
Related Products
-

Gender Ratio Customer Analysis 3D Circle Graph – Insights for Market Understanding
#Market and Competitor Analysis #Graph #Other
-

Pie Chart of Camping Business Market Share by European Country
#Market and Competitor Analysis #Graph #Other
-

Market Share Analysis of European Countries – Insights for Market Analysis
#Market and Competitor Analysis #Graph #Other
-

Creative Line PPT Pie Chart Analysis – Visualizing Market Share
#Market and Competitor Analysis #Graph #Market Share
