Business Goals 3D Footprint Diagram – Vision and Success
RJ0300036_18
- Last Update 04/27/2025
- File Size 2MB
- # of Slides 2
- File Format PPTX
- Slide Ratio 16:9
- Color
Keywords
- #Content-Based Slides
- #Design-Based Slides
- #Business Vision and Strategy
- #Marketing Plan and Strategy
- #Diagram
- #Business Goals
- #Marketing Objectives
- #Cluster
- #Chain Diagram
- #16:9
- #footprint diagram PowerPoint
- #4-step connection diagram slide
- #business goals visualization template
- #vision to success process PPT
- #marketing strategy diagram slide
About the Product
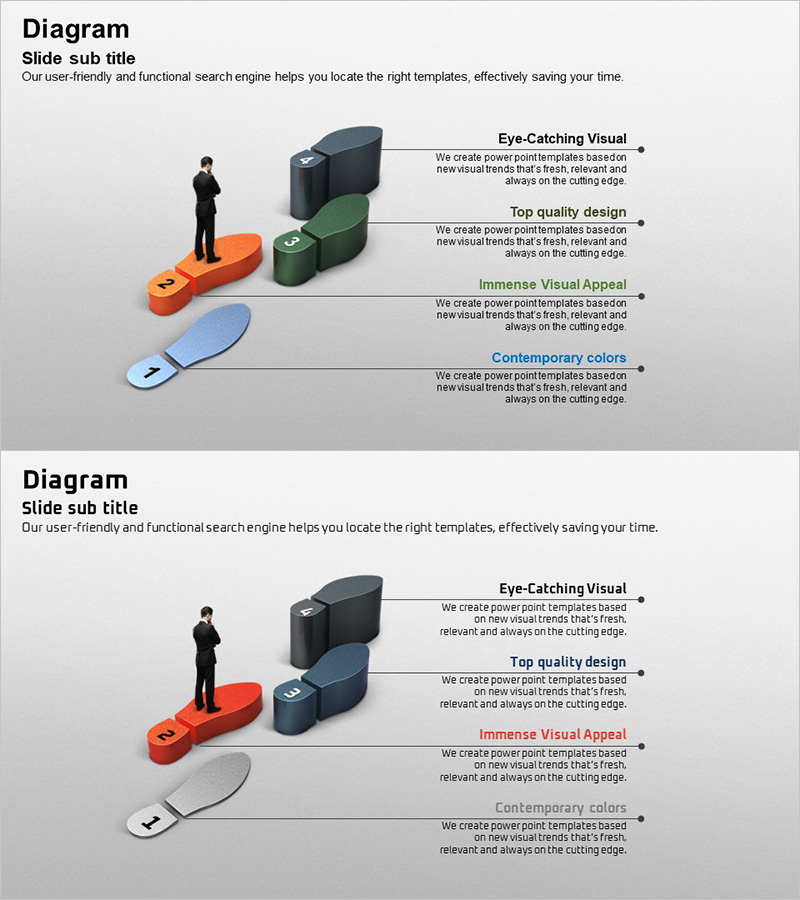
A 4-step footprint connection diagram PowerPoint slide that visualizes business objectives and vision through sequential progression. Orange, green, and blue 3D footprint-shaped nodes are connected by arrows, intuitively representing the journey toward success. This presentation slide effectively communicates goal-achievement processes in business presentations, marketing plans, and strategic briefings. The 2-slide set supports various text layouts and is optimized for modern 16:9 widescreen presentation environments.
Usage Points
-
Main Usage
Visualizes the business goal achievement process through 4 sequential footprint nodes, clearly representing the journey from vision to success. Effectively communicates stage-by-stage progress and final objectives in marketing strategy, business planning, and organizational goal presentations.
-
How to Use
Enter stage-specific goal titles in the 4 footprint nodes and add detailed descriptions in the right-side text areas. The color-coded nodes and directional arrows emphasize left-to-right process flow. Maintains excellent readability on large conference room displays and online presentations alike.
-
Recommended For
Marketing professionals, business planning teams, executives preparing reports, consultants, and educators explaining goal-achievement strategies. Particularly effective for new business launches, organizational transformation initiatives, and growth strategy presentations where step-by-step roadmaps need clear visual representation.
-
Slide Structure
2-slide set with 4 3D footprint nodes on the left connected sequentially by arrows, and corresponding text explanation areas on the right. Multi-color nodes (orange, green, blue, gray) provide visual distinction. Optimized for 16:9 widescreen format in contemporary presentation environments.
Related Products
-

Business Goals Connection Diagram
#Business Vision and Strategy #Marketing Plan and Strategy #Diagram
-

Business Goals Connection Diagram – Linking Objectives and Vision
#Business Vision and Strategy #Marketing Plan and Strategy #Diagram
-

Marketing Objectives Triangle Diagram – For Business Strategy
#Business Vision and Strategy #Marketing Plan and Strategy #Diagram
-

Diagram Introducing Business Objectives by Area
#Business Vision and Strategy #Marketing Plan and Strategy #Diagram
