Business Income Statement Table – Visualizing Financial Performance
RJ0300036_15
- Last Update 04/27/2025
- File Size 1.2MB
- # of Slides 2
- File Format PPTX
- Slide Ratio 16:9
- Color
Keywords
- #Content-Based Slides
- #Design-Based Slides
- #Financial Plans and Performance
- #Diagram
- #Income Statement
- #Table
- #Standard Table
- #16:9
- #income statement table PowerPoint
- #financial table slide template
- #profit and loss statement PPT
- #financial data visualization slide
- #business table presentation template
About the Product
A professional income statement table PowerPoint slide designed to clearly present financial performance data. This 2-slide set is optimized for 16:9 widescreen format and features a structured table layout with dark header rows and light data rows for maximum clarity. The design effectively displays revenue, expenses, and net income categories, making financial information immediately comprehensible to investors, executives, and stakeholders. Ready to use in business presentations, financial reports, investor pitches, and quarterly earnings announcements.
Usage Points
-
Main Usage
Present financial performance data in a structured table format that clearly communicates revenue, expenses, and net income to investors, executives, and stakeholders. The organized layout enhances credibility and makes financial analysis immediately understandable to presentation audiences.
-
How to Use
Use in business plans, financial reports, investor presentations, quarterly earnings announcements, and pitch deck meetings. Simply input your actual financial figures into the table cells to compare performance across periods, departments, or business units. Suitable for both historical analysis and projected financial scenarios.
-
Recommended For
CFOs, financial managers, executives, investor relations specialists, accountants, and business consultants. Ideal for startups seeking investment funding, small businesses presenting to banks, large corporations reporting quarterly results, and any organization needing to communicate financial data professionally.
-
Slide Structure
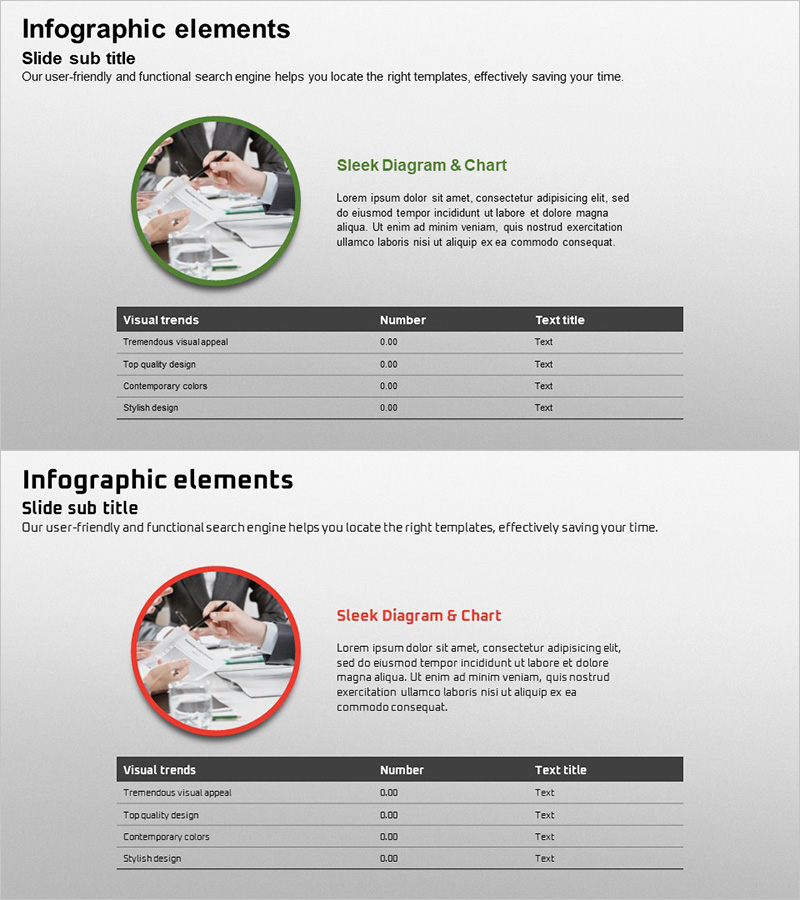
2-slide set featuring income statement tables with contrasting visual frames—green circular frame on slide 1 and red circular frame on slide 2. Each table contains 3 rows (revenue, expenses, net income) × 4 columns (item name, figure 1, figure 2, figure 3) with clearly defined data entry areas for easy customization.
Related Products
-

Business Sales and Profit Calculation Table – Essential Slide for Financial Planning
#Financial Plans and Performance #Diagram #Income Statement
-

Business Income Statement – Visualizing Financial Performance
#Financial Plans and Performance #Diagram #Income Statement
-

Income Statement Table for Visualizing Financial Performance - Insights Navigator
#Financial Plans and Performance #Diagram #Income Statement
-

Key Financial Indicators Table – Effective Data Presentation
#Financial Plans and Performance #Diagram #Income Statement
