Elevator PPT Template – Modern and Sleek Design
B0800026
- Last Update 01/03/2025
- File Size 4.1MB
- # of Slides 20
- File Format PPTX
- Slide Ratio 4:3
- Color
Slide Preview

Keywords
About the Product
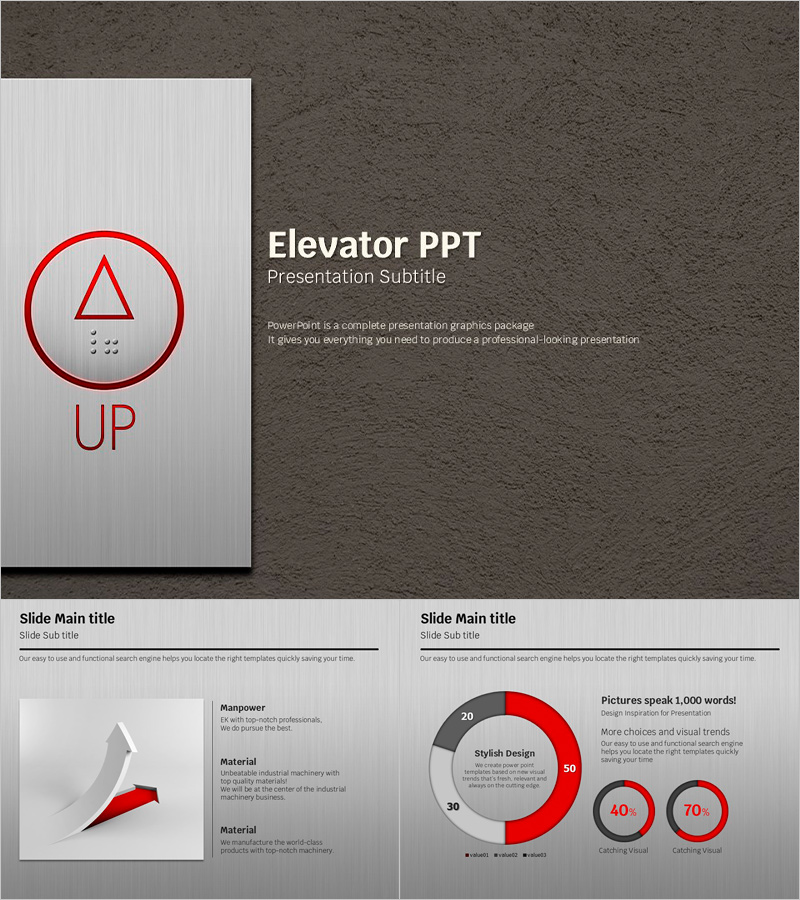
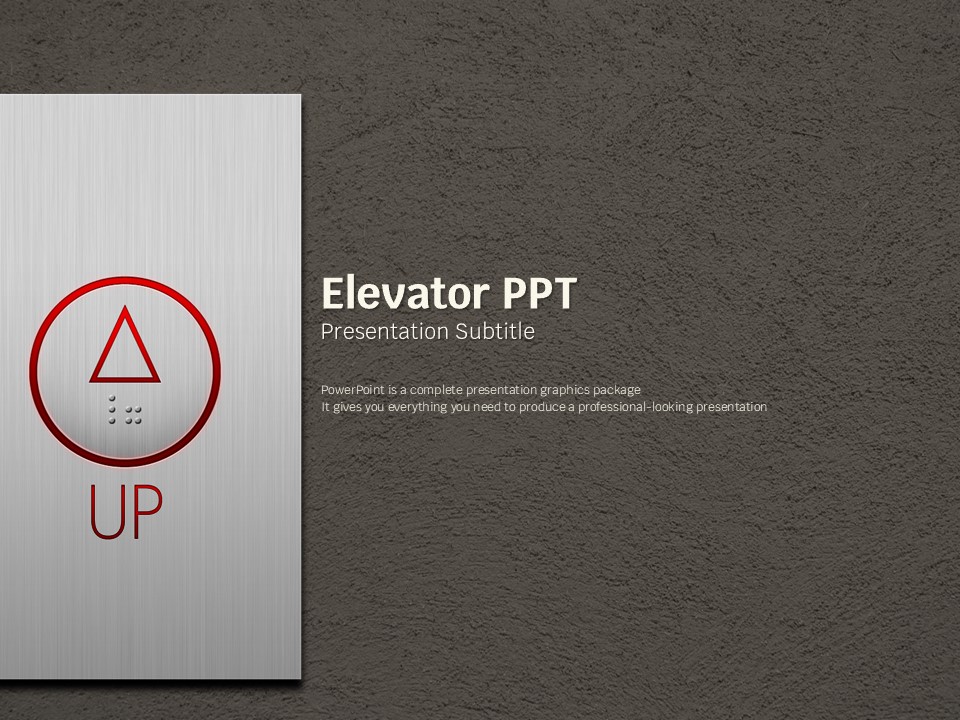
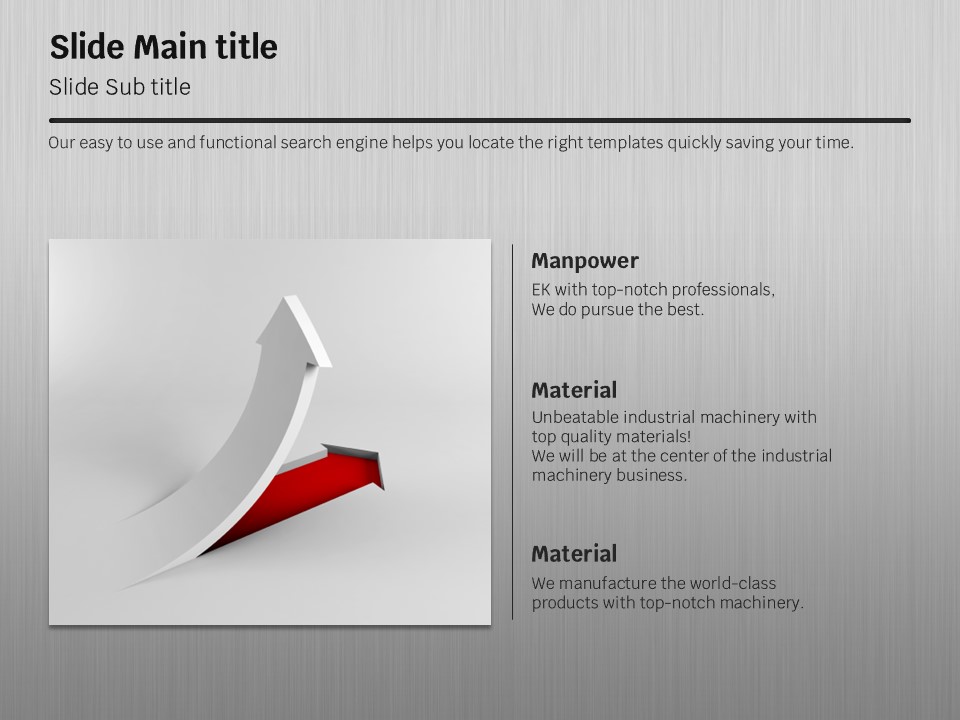
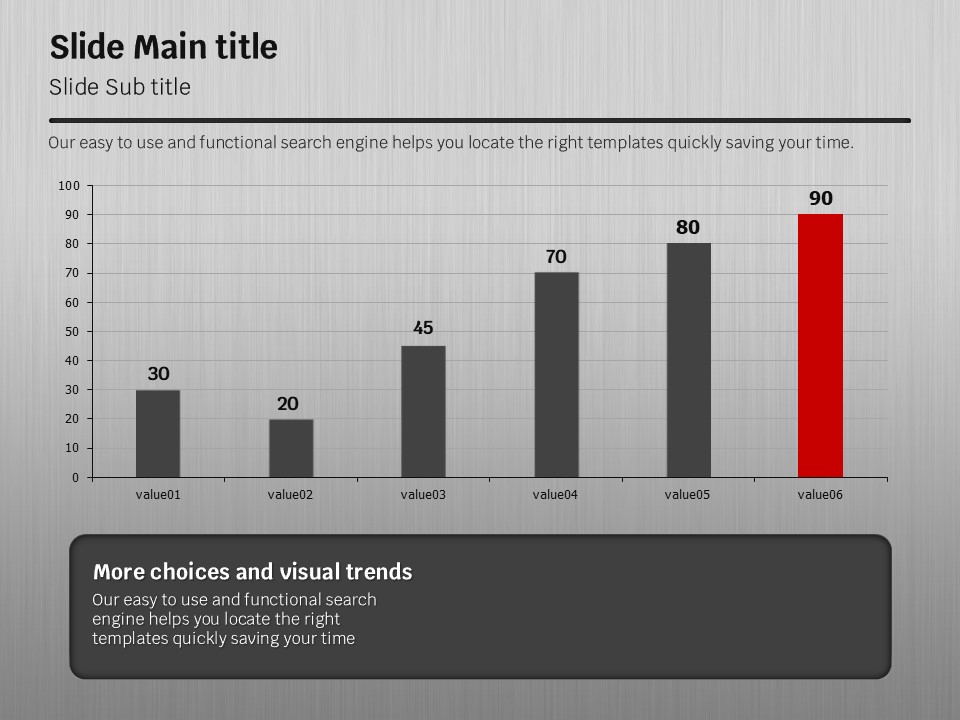
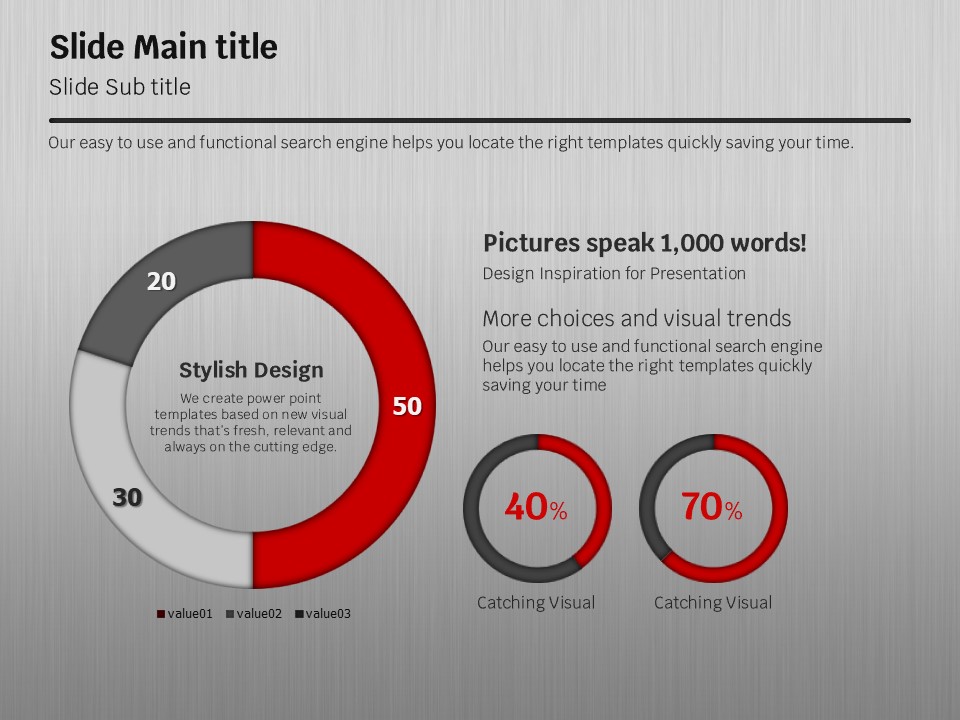
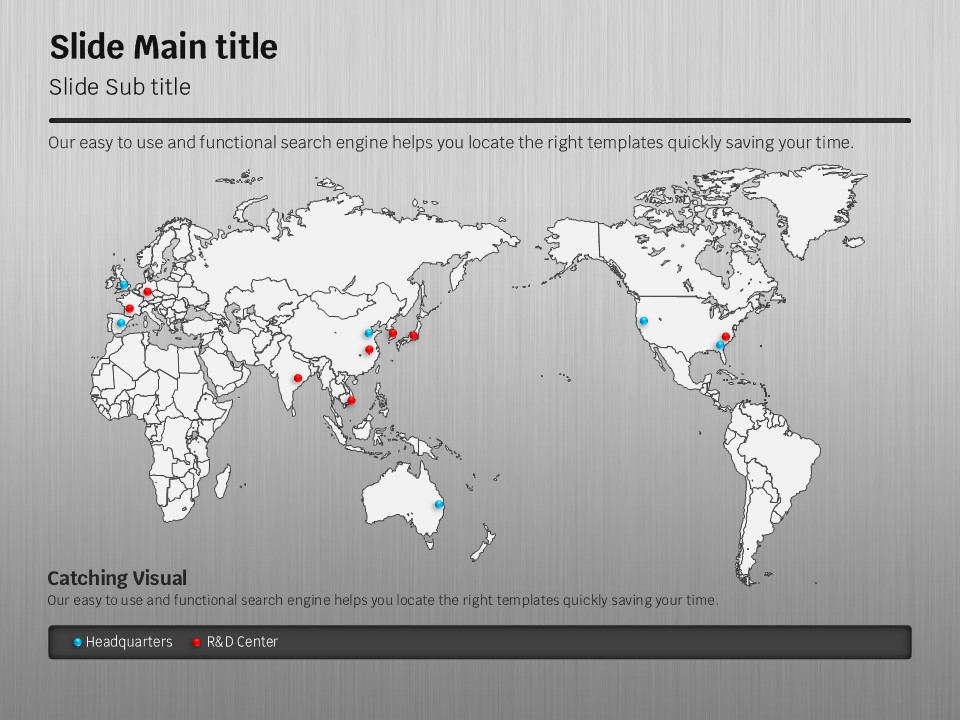
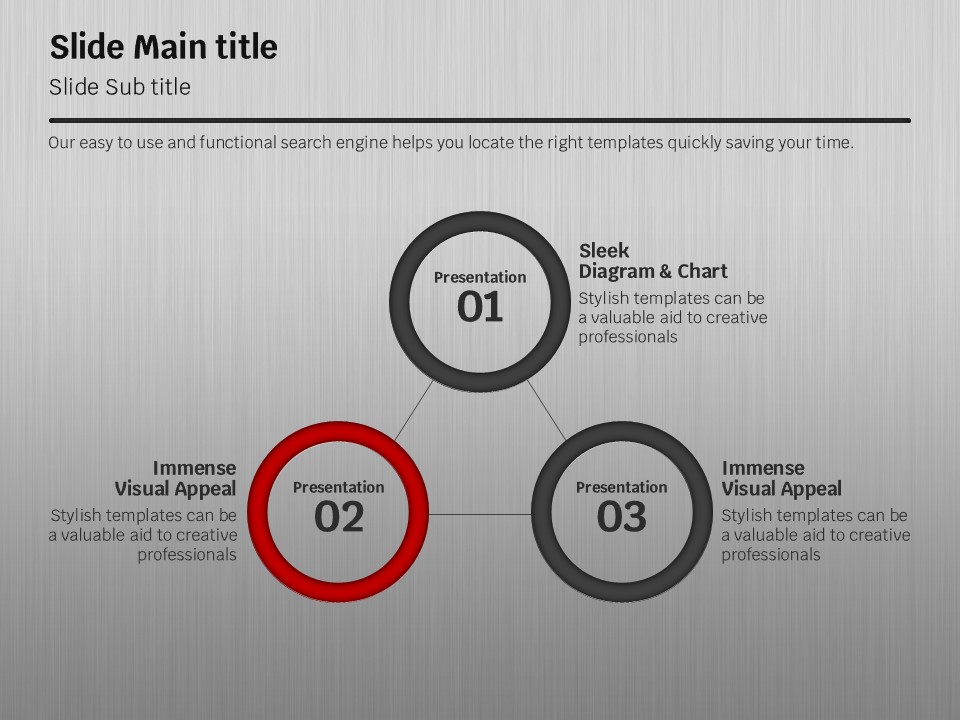
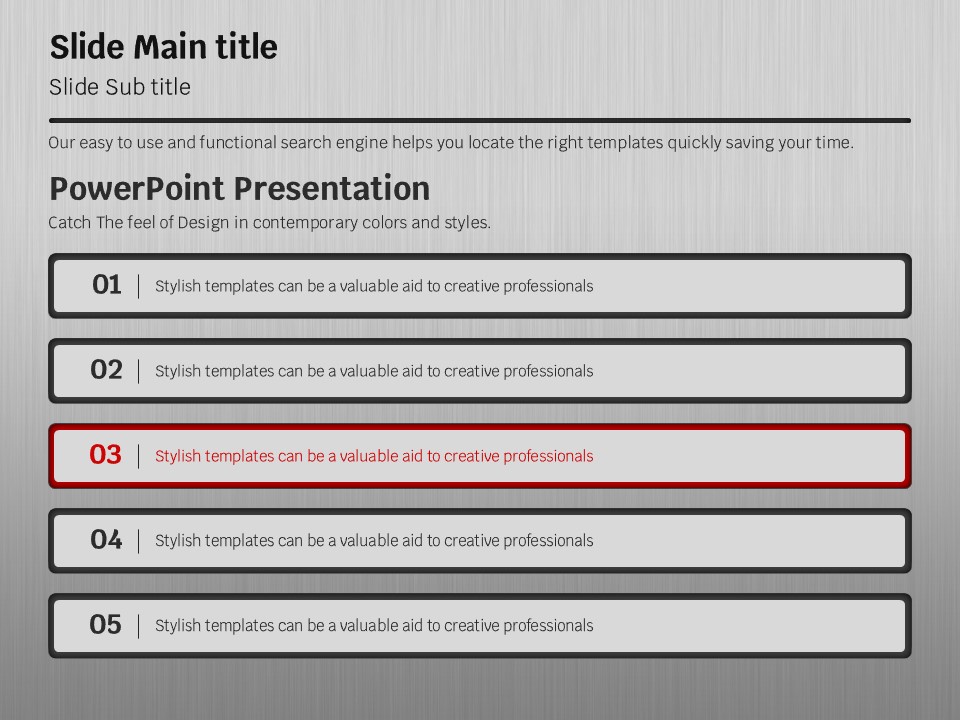
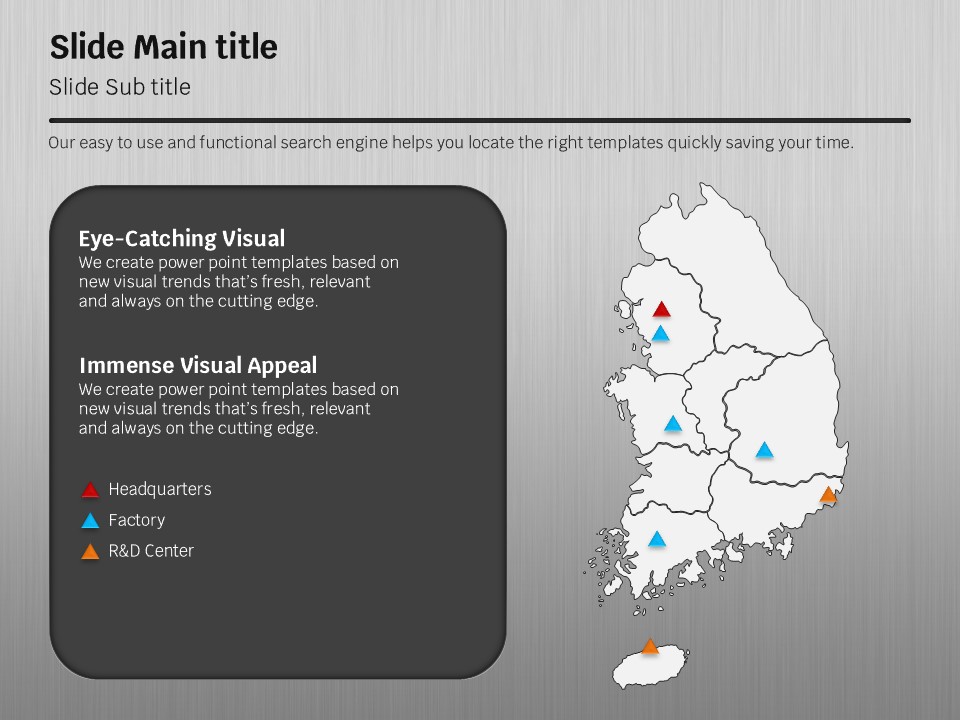
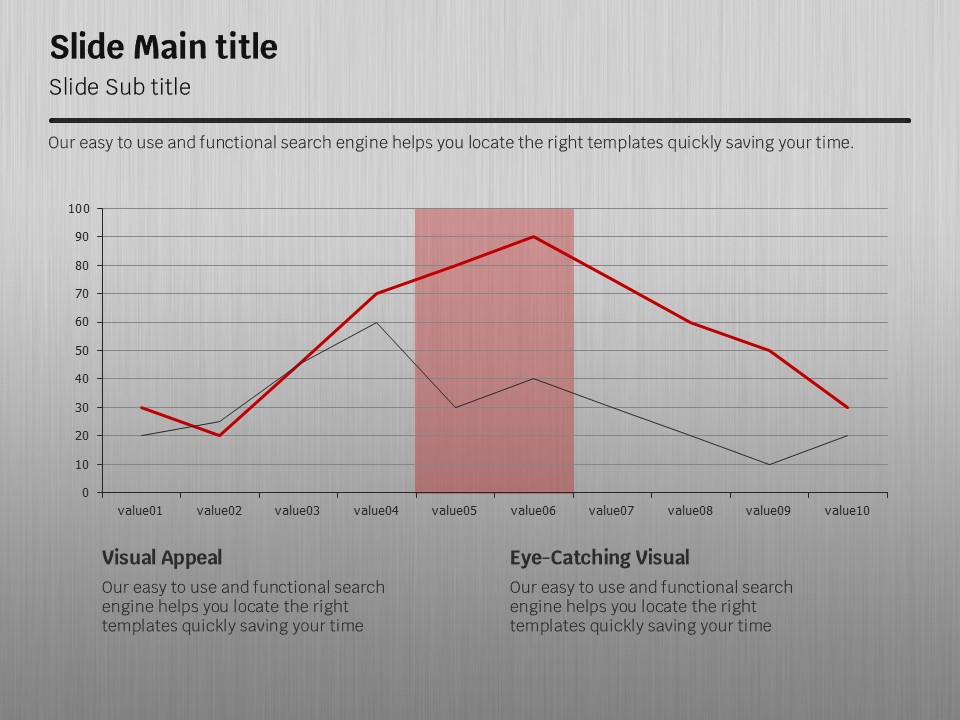
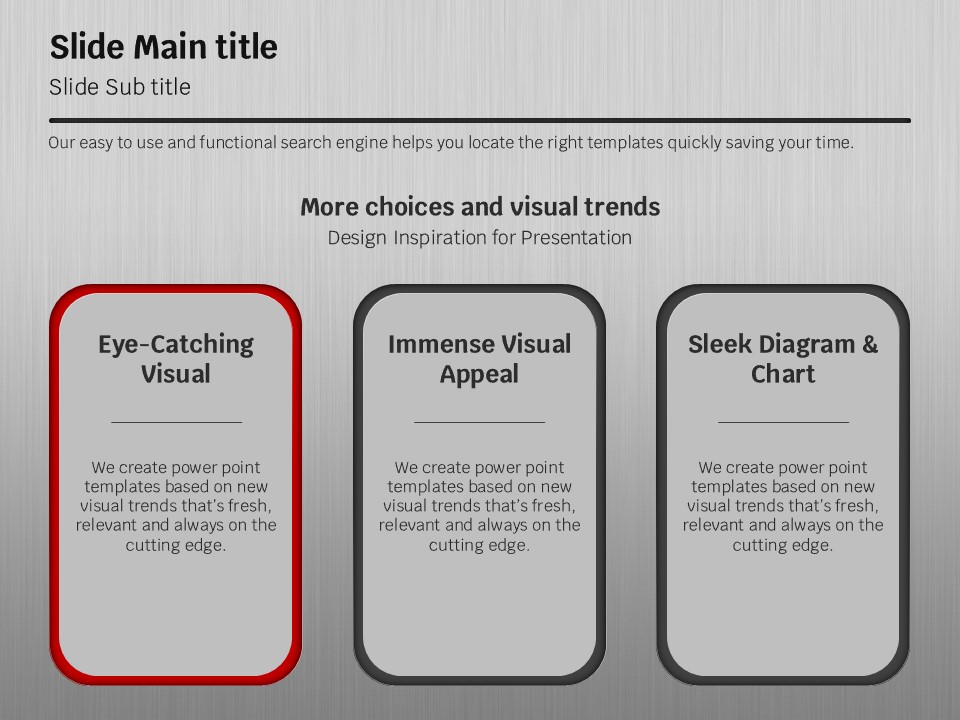
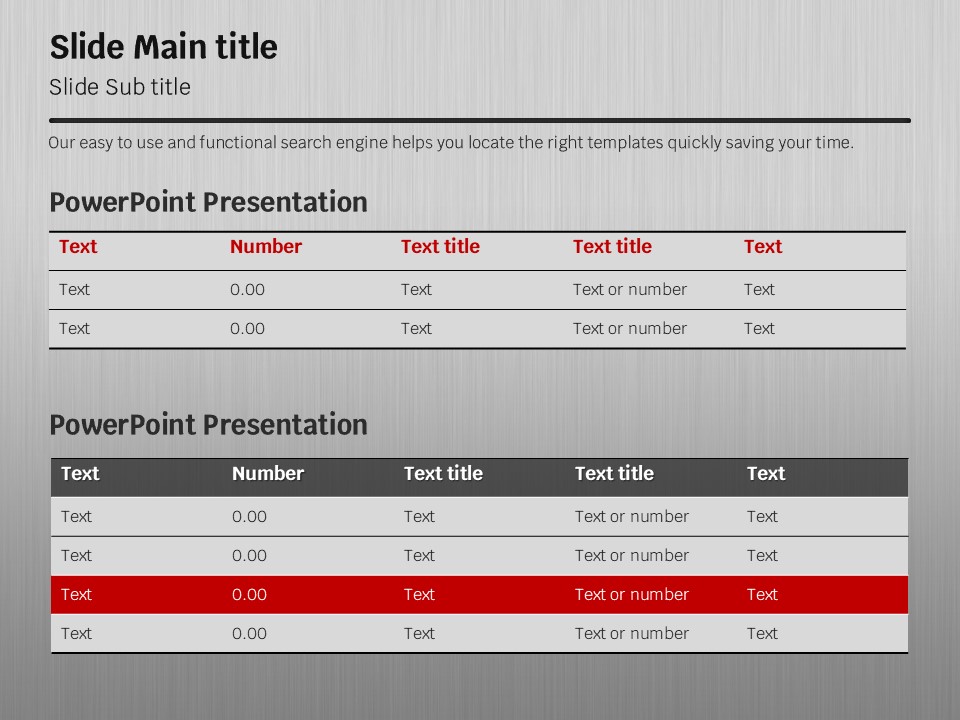
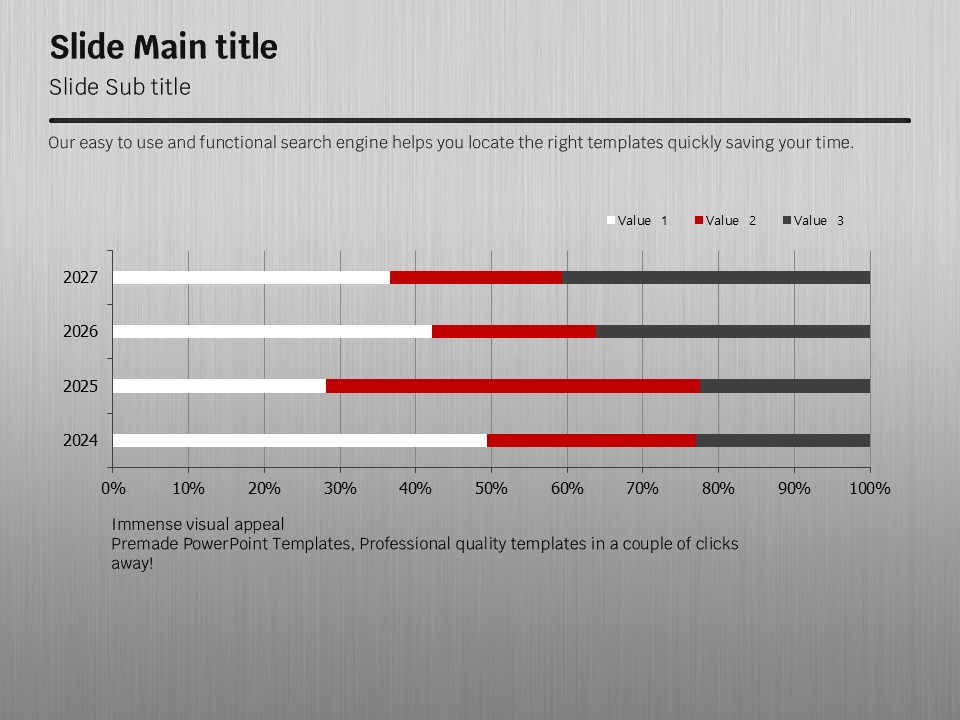
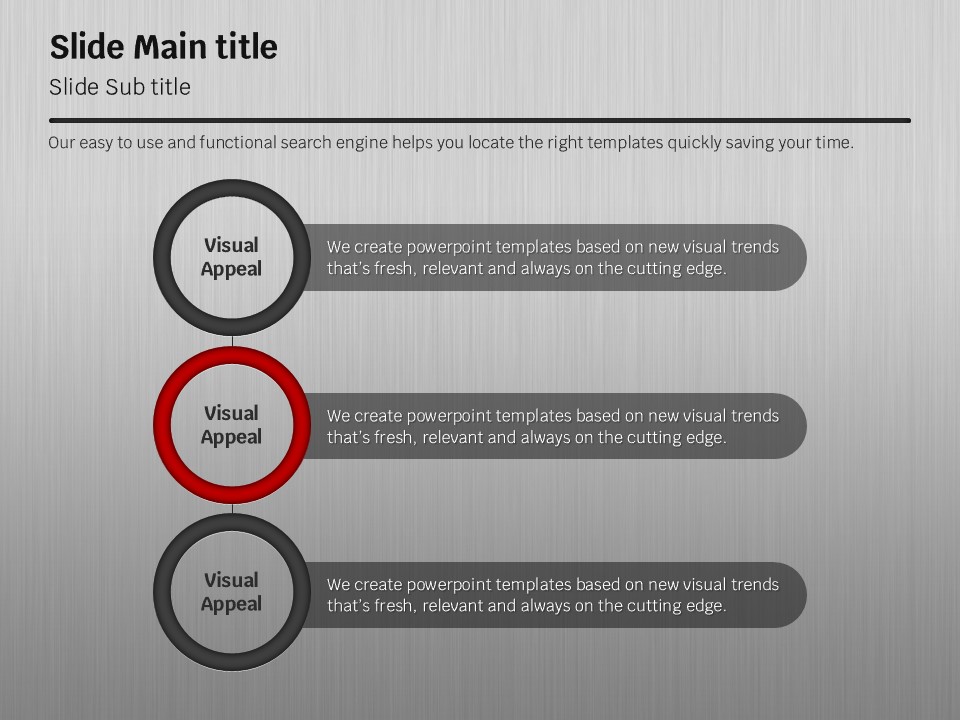
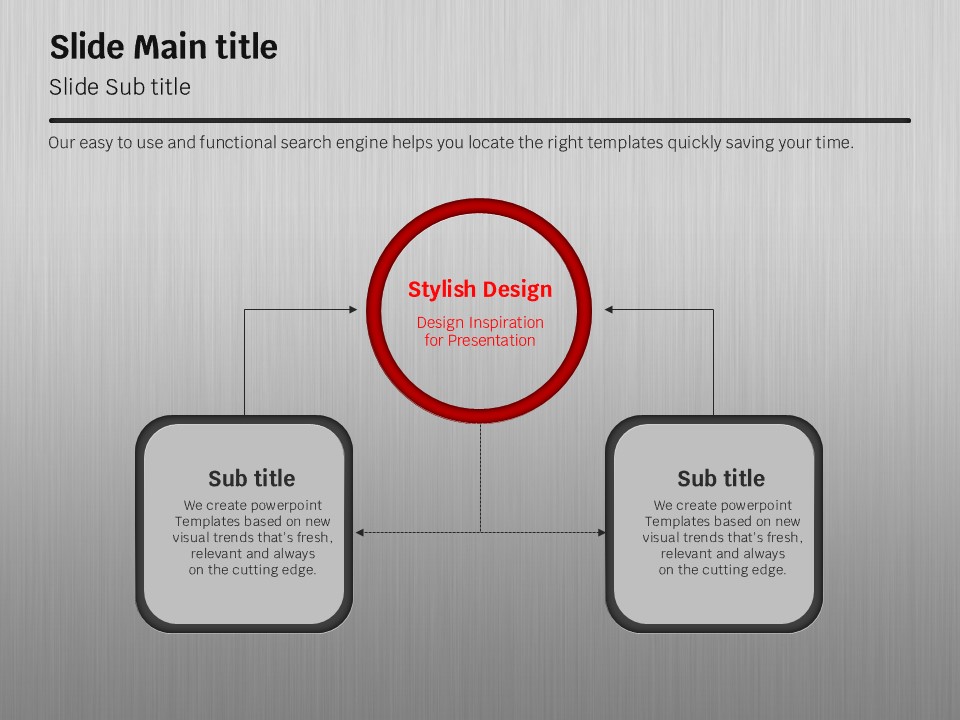
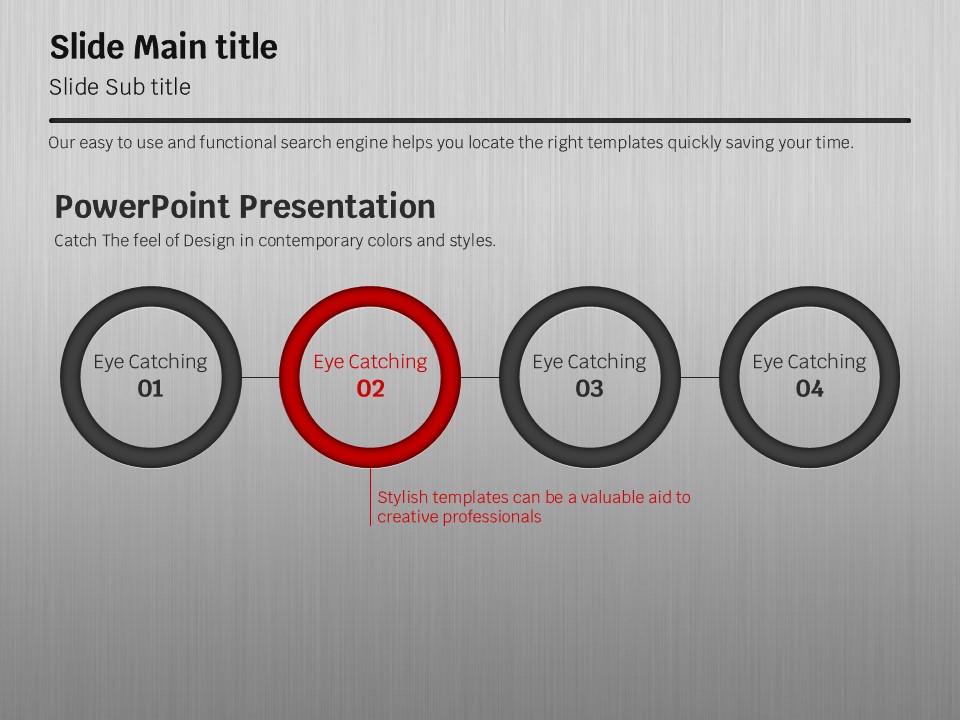
A bold industrial-style PowerPoint template combining a brushed metal silver panel with a charcoal gray background and sharp red accent colors. The red highlights draw attention to key data points and core messages across every slide, making complex information easy to follow. This 20-slide presentation deck includes a cover slide featuring an elevator UP button motif that visually communicates growth and momentum, along with infographic layouts, donut charts, percentage circle graphs, a location map slide with marker icons, and a line chart for trend analysis. Designed for manufacturing, construction, logistics, and heavy industry sectors, the template is ready to use for investor IR presentations, business status reports, and corporate briefings. Fully editable PPTX format allows you to replace text, update chart data, and swap the red accent color to match your brand identity.
Usage Points
-
Main Usage
Ideal for corporate presentations in manufacturing, construction, logistics, and heavy industry sectors, including investor IR decks, business status reports, and executive briefings that require a strong, authoritative visual tone.
-
How to Use
Open the PPTX file, replace placeholder text and chart data with your actual content, and optionally swap the red accent color to your brand color. All shapes, charts, and map markers are fully editable in PowerPoint.
-
Recommended For
Recommended for planning and sales teams at manufacturing or construction firms, executives preparing investor presentations, and strategy planners producing business performance reports who need a professional, data-driven slide deck.
-
Slide Structure
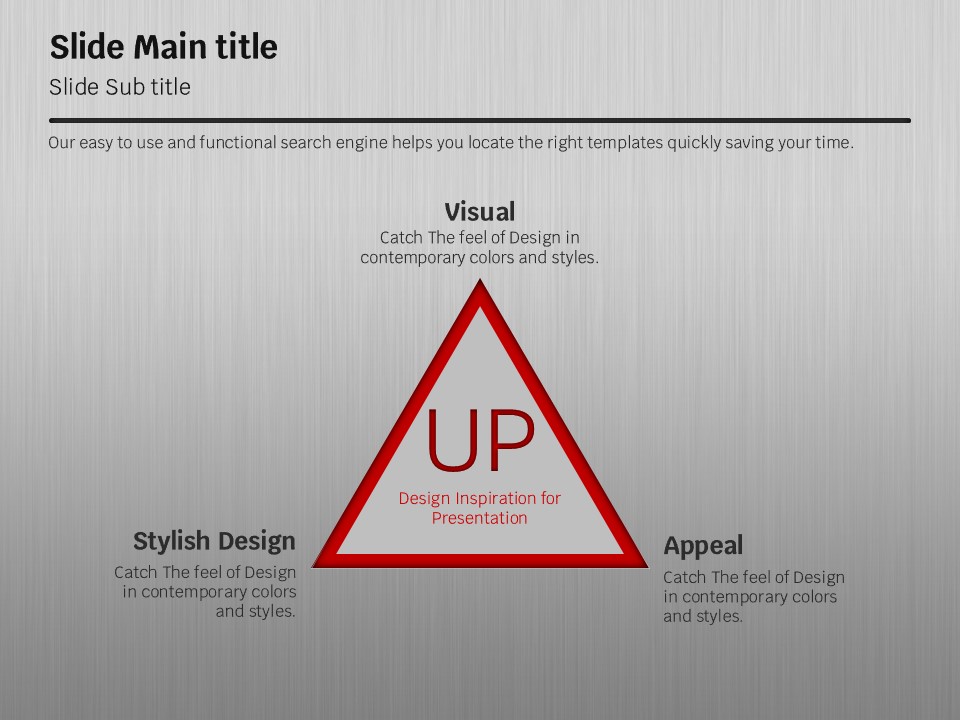
20 slides including: cover (brushed metal panel + red circle icon), 3D arrow infographic with 3-column text, donut chart + percentage circle graphs (40% / 70%), Korea location map with HQ / Factory / R&D markers, and a dual-line trend chart with highlighted range.


