Insights by Location – Data Visualization and Analysis
RB0800026_10
- Last Update 03/23/2025
- File Size 1.3MB
- # of Slides 2
- File Format PPTX
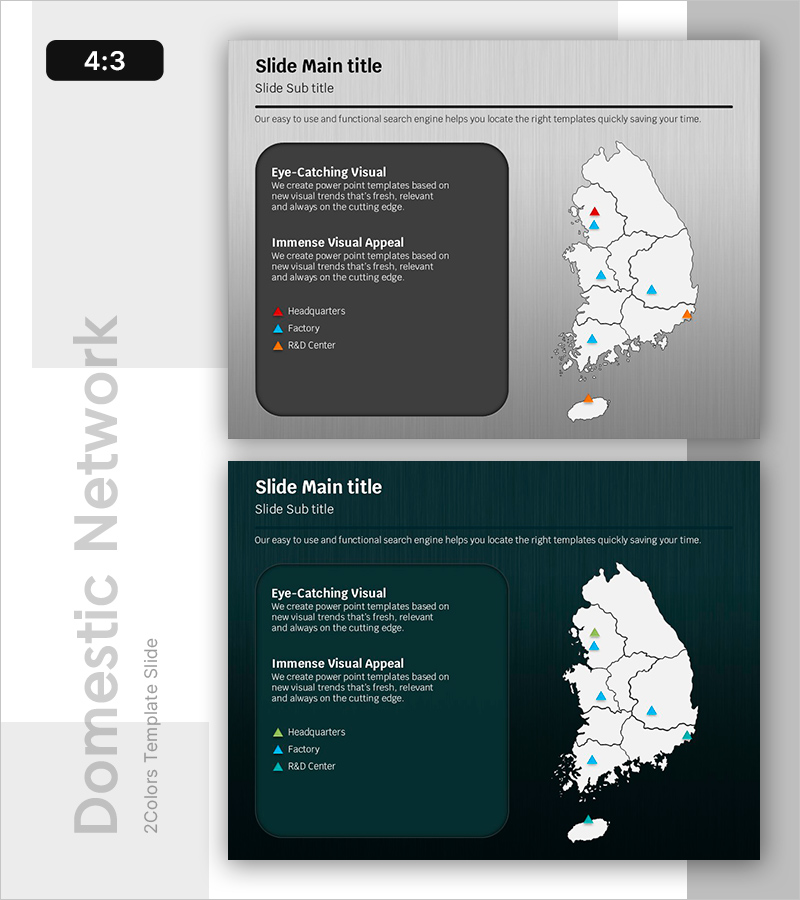
- Slide Ratio 4:3
- Color
Keywords
About the Product
A location-based PowerPoint slide featuring a South Korea map with headquarters, factories, and R&D centers marked in three distinct colors. The left side displays a dark rounded box with descriptive text and a legend, while the right side showcases the map with color-coded location markers. This two-column layout instantly communicates your company's global network, business locations, and service regions. Available in 4:3 aspect ratio PPTX format, it integrates seamlessly into existing presentations and allows full customization of text and marker colors.
Usage Points
-
Main Usage
Visualize your company's global locations, business regions, and service networks on a map to communicate organizational scale and geographic expansion to investors, partners, and clients. Color-coded markers distinguish functional locations such as headquarters, manufacturing facilities, and R&D centers while conveying operational structure.
-
How to Use
Use this slide in the company overview section to present global networks and business status, or in expansion strategy and market entry presentations to illustrate regional location distribution. Customize the text boxes and marker positions with your actual location data for a tailored presentation.
-
Recommended For
Ideal for business planners, marketing teams, and executives preparing company profiles, business plans, investor pitch decks, and marketing strategy presentations. Particularly effective when emphasizing multi-regional operations, global expansion, or region-specific business strategies.
-
Slide Structure
Two-column layout with a dark rounded box on the left (two text sections plus three-item legend) and a South Korea map on the right (five to six color-coded location markers). Fully editable text areas and marker positions accommodate various location datasets and customization needs.
Related Products
-

Key Locations with Speech Bubble Indicators
#Company Introduction #Product/Service Introduction #Other
-

Navy-Orange Map Slide – Company Introduction and Resource Allocation
#Company Introduction #Other #Domestic Network
-

Map of Domestic Networks and Partners in the U.S. – Orange, Green, Purple
#Company Introduction #Other #Customers and Partners
-

Visualizing Marketing Strategy with Navy Red Map Infographic
#Company Introduction #Marketing Plan and Strategy #Other
