A Roadmap to Achieving Goals – Intuitive Diagram
RB0800026_19
- Last Update 03/23/2025
- File Size 1.1MB
- # of Slides 2
- File Format PPTX
- Slide Ratio 4:3
- Color
Keywords
About the Product
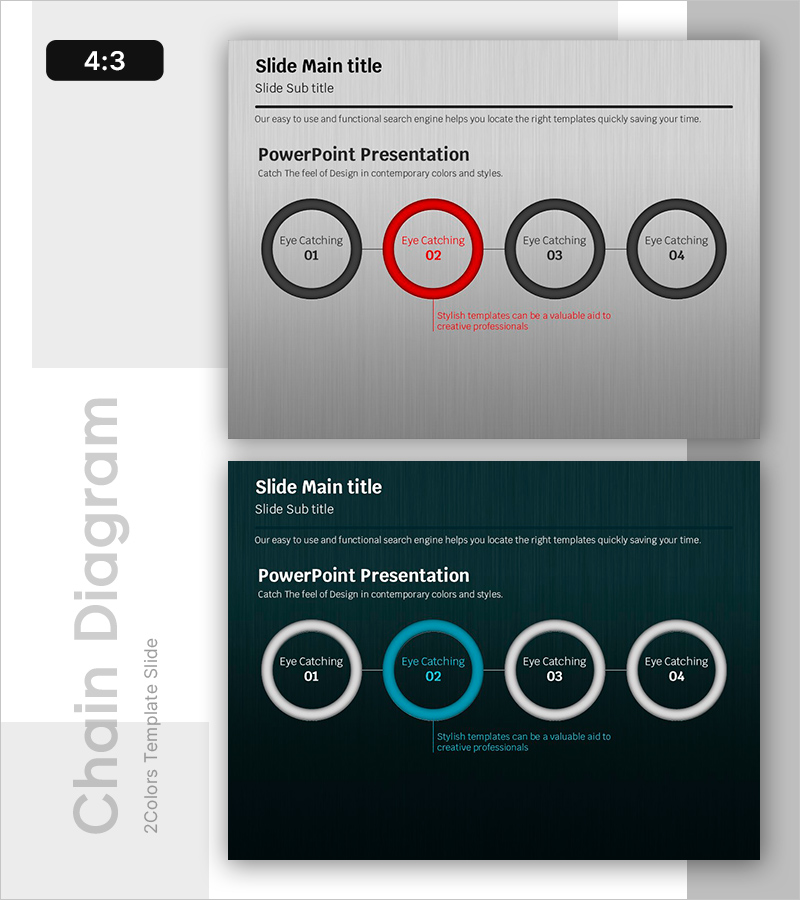
A PowerPoint slide featuring a 4-node circular diagram for expressing goal achievement processes. The design uses a light gray background with black and red two-tone circular nodes, where the central red circle serves as the emphasis point. Linear connector lines clearly distinguish each stage, with a description text area below for adding detailed content. The 2-slide set (4:3 ratio) includes both light and dark background versions, making it adaptable to various presentation contexts. Ideal for presentations, business proposals, and planning documents where step-by-step progression and cyclical processes need clear visual communication.
Usage Points
-
Main Usage
Clearly present project phases, business cycles, goal achievement roadmaps, and process flows across 4 sequential stages. The circular structure emphasizes continuity and repetition, helping audiences understand interconnected progression and cyclical workflows.
-
How to Use
Enter stage names, objectives, owners, and timelines into each circular node. Add detailed descriptions in the text area below. Use the red circle to highlight the current phase or key focus point. Apply the light background for bright presentation venues and the dark background for dark-themed presentations.
-
Recommended For
Project managers, marketing professionals, strategy planners, educators, consultants. Use in business plans, marketing proposals, project pitches, training materials, and executive reports to explain implementation phases and goal achievement pathways.
-
Slide Structure
Four circular nodes connected by linear connector lines in a cyclical arrangement. The central red circle functions as the emphasis element, while the remaining three nodes feature black borders. Each node contains a text input area. An additional description text box is positioned at the bottom. Both slides maintain identical structure with only background color variation (light gray and dark navy).
Related Products
-

Introduction to the Food Judges – Team Introduction Slide
#Company Introduction #Diagram #Manpower
-

Travel Table of a Curious Child – Creative Data Visualization
#Business Management #Financial Plans and Performance #Diagram
-

Sea Wide PowerPoint Stage Diagram - Business Strategy and Service Execution
#Business Vision and Strategy #Technical Approach #Diagram
-

Business Solutions Analysis Objectives – Product/Service Introduction
#Product/Service Introduction #Diagram #Other
