Financial Metrics at a Glance – Data Visualization Slide
RB0800026_13
- Last Update 03/23/2025
- File Size 1.1MB
- # of Slides 2
- File Format PPTX
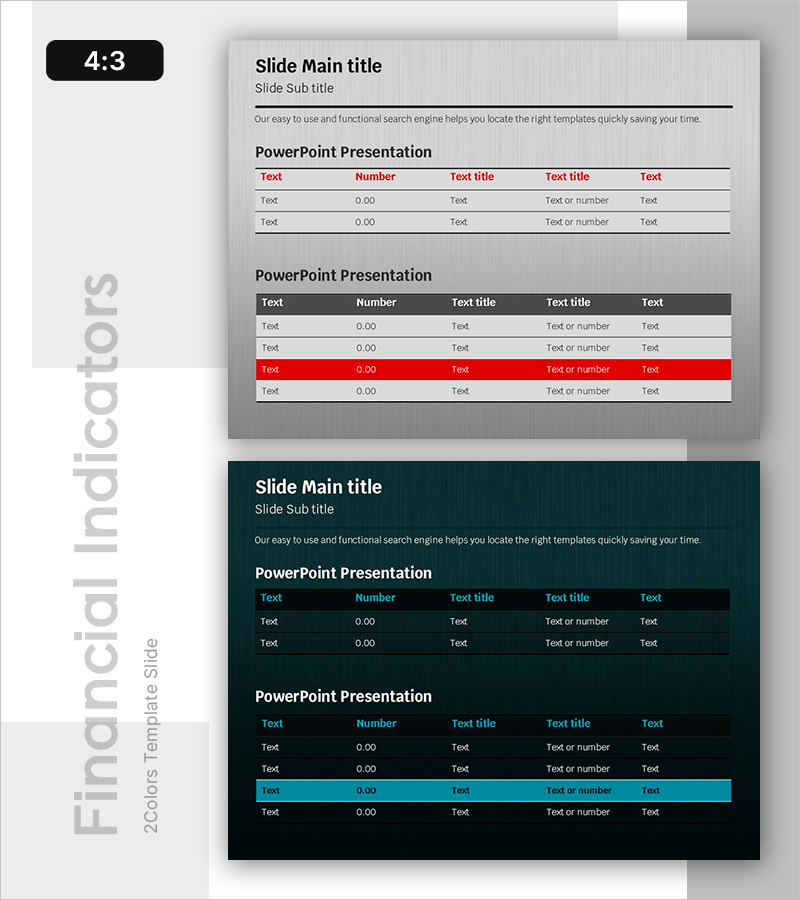
- Slide Ratio 4:3
- Color
Keywords
About the Product
A table-based PowerPoint slide designed to compare financial metrics and numerical data at a glance. Features two layout versions: one with a light gray background and black header with red accent row, and another with a dark teal background and cyan accent row. The table structure includes 5 columns (Text, Number, Text title, etc.) and 4 rows for organized data presentation. Fully editable PPTX format allows instant customization for financial reports, business analysis, performance reviews, and executive dashboards.
Usage Points
-
Main Usage
Organize financial figures, performance indicators, and cost items in a structured matrix format for quick comparative analysis. Black header rows and red accent rows highlight critical data points visually, making key metrics stand out during presentations.
-
How to Use
Double-click any cell (Text, Number, Text title) to enter your data directly. Add or remove rows via the table's right-click menu. Modify colors using the Table Design tab in PowerPoint. Choose between light or dark background versions to match your presentation theme.
-
Recommended For
Finance teams presenting quarterly earnings reports, executives analyzing financial indicators, investor pitch decks, marketing teams comparing campaign performance metrics, operations teams building KPI dashboards, and management reviews requiring data-driven insights.
-
Slide Structure
Two-slide set with identical 5-column × 4-row table structure. Slide 1: Light gray background with black header, white data rows, and red accent row. Slide 2: Dark teal background with cyan header, white data rows, and cyan accent row. Both fully editable for seamless data input.
Related Products
-

SEO System Configuration Diagram – Technology Sector Strategy
#Business Vision and Strategy #Technical Approach #Diagram
-

PowerPoint Template for Service Operation Strategy Presentation
#Business Management #Operational Plan #Technical Approach
-

Business Promotion Strategy Diagram – Effective Marketing Plan
#Business Vision and Strategy #Marketing Plan and Strategy #Diagram
-

Business Program Analysis Area Graph – Competitive Edge
#Market and Competitor Analysis #Diagram #Graph
