Market Share Analysis with Donut Chart – In-depth Understanding of Market and Competitors
RB0800026_6
- Last Update 03/23/2025
- File Size 1.1MB
- # of Slides 2
- File Format PPTX
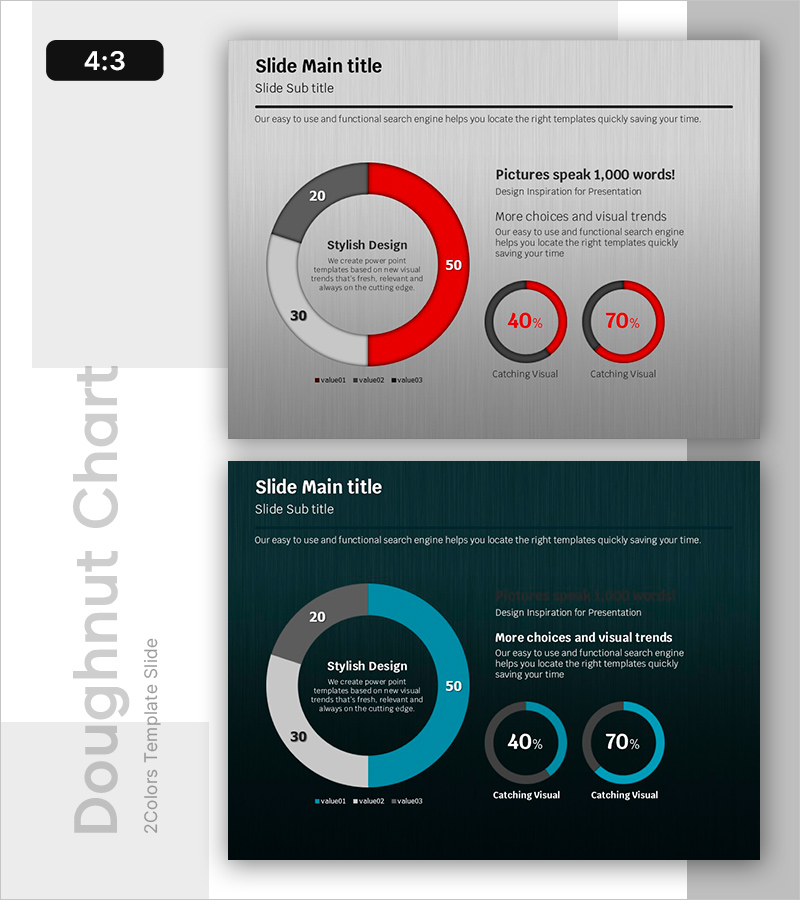
- Slide Ratio 4:3
- Color
Keywords
About the Product
A donut chart PowerPoint slide designed for market share and competitive analysis presentations. The design features a three-segment donut ring (red 50%, gray 30%, black 20%) with a central circular area for key messaging. Two additional circular gauge charts on the right highlight 40% and 70% metrics for comparative data visualization. The minimalist gray background layout integrates seamlessly into business reports, marketing plans, and market analysis documents. Provided as a 2-slide set in PPTX format with fully editable elements including colors, values, and text. Perfect for executives, analysts, and strategists presenting data-driven insights to stakeholders.
Usage Points
-
Main Usage
Visualize proportional relationships such as market share, product composition ratios, and customer distribution using a donut chart. The central circular area emphasizes key messaging or brand identity, while the outer donut segments use color differentiation to intuitively convey each category's proportion of the whole.
-
How to Use
Apply this slide to market overview sections in business reports, competitive analysis pages in marketing plans, and market size explanations in investor pitch decks. Customize the donut segment colors and percentages to match your data, replace central text with company or product names, and use immediately in presentations without additional design work.
-
Recommended For
Marketing managers, executives, business strategists, consultants, and data analysts who need to communicate proportional data effectively. Ideal for market analysis, competitive benchmarking, customer segmentation, and product portfolio composition presentations.
-
Slide Structure
Slide 1: Three-segment donut chart (red, gray, black) with central message area and legend. Slide 2: Same donut chart with two circular gauge indicators (40%, 70%) and text description zone. 4:3 aspect ratio, PPTX format with fully editable shapes, text, and color elements.
Related Products
-
![Analysis of [3 Key Factors] with Donut Chart - Market Status and Share](https://image.goodpello.com/2025/08/16/9c5d48b8-118b-499e-a39c-4b78a2acdc1e.jpg?w=300&h=336&format=auto)
Analysis of [3 Key Factors] with Donut Chart - Market Status and Share
#Market and Competitor Analysis #Graph #Market Status
-

Sales Status by Food Truck Product – Market Share Analysis
#Market and Competitor Analysis #Graph #Market Status
-

Construction Site Donut Chart – Market Share Visualization
#Market and Competitor Analysis #Graph #Market Status
-

Donut Chart Slide for Game Category Analysis
#Market and Competitor Analysis #Graph #Market Status
