Bar Chart of Key Segments – Data Analysis and Performance Visualization
RB0800026_15
- Last Update 03/23/2025
- File Size 1.1MB
- # of Slides 2
- File Format PPTX
- Slide Ratio 4:3
- Color
Keywords
About the Product
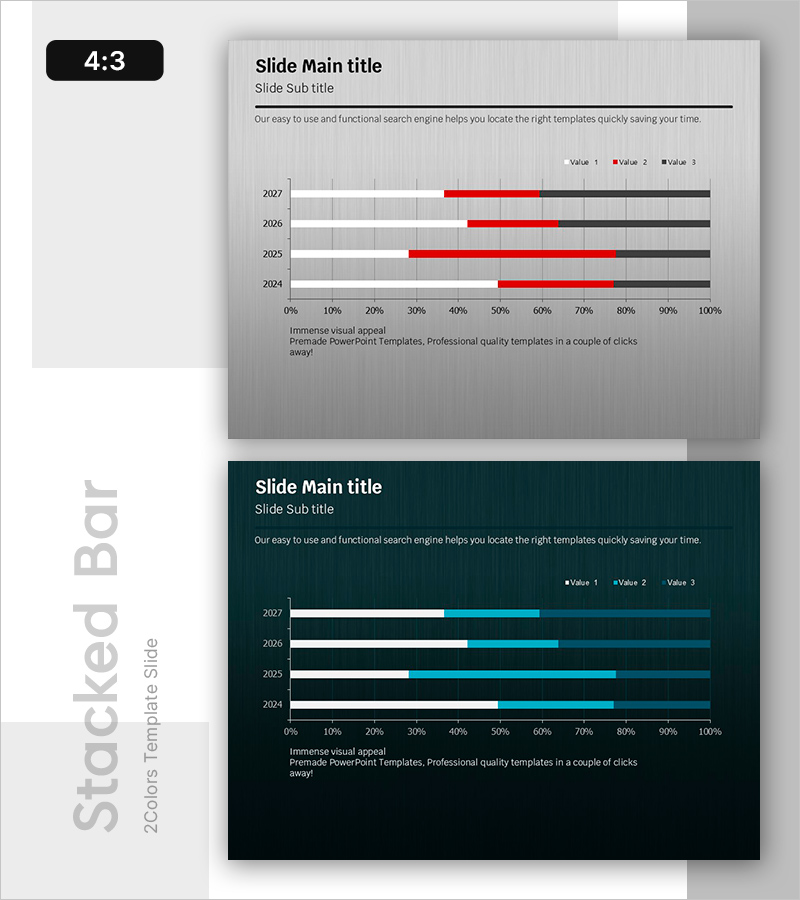
A PowerPoint slide template featuring a horizontal bar chart that visualizes three-series data across multiple years. This presentation slide displays performance metrics from 2024 to 2027 with color-coded bars in gray, red, and black for easy comparison. The chart is designed for business performance analysis, marketing data visualization, and financial reporting. This PPT slide template is ready to download and edit immediately for quarterly reports, annual reviews, and investor presentations. Provided in 4:3 aspect ratio with 2 slides.
Usage Points
-
Main Usage
Designed to compare three or more data series across different time periods or categories simultaneously. Effectively communicates business metrics, sales performance, marketing results, and financial indicators through visual representation.
-
How to Use
Edit the bar lengths and colors to match your data values. Replace the legend labels (Value 1, 2, 3) with your actual category names, update the year labels to your time periods, and input your numerical data. The slide is immediately ready for presentation use.
-
Recommended For
Ideal for business reports, quarterly and annual performance presentations, marketing campaign analysis, financial results briefings, executive summaries, and investor pitch decks. Recommended for executives, business analysts, marketing professionals, and data-driven decision makers.
-
Slide Structure
2-slide template in 4:3 aspect ratio. Each slide contains a title, subtitle, and description text area alongside a horizontal bar chart. The chart displays 4 years (2024–2027) on the Y-axis and a 0–100% scale on the X-axis. Three color-coded series (gray, red, black) represent different data categories, with a legend on the right for easy identification.
Related Products
-

Visualizing Current Internet Shopping Payment Technologies with Horizontal Bar Graph
#Business Introduction #Market and Competitor Analysis #Graph
-

Writing Instrument Icon Horizontal Bar Chart – Market and Technology Overview
#Business Introduction #Market and Competitor Analysis #Graph
-

Market Research and Trend Segmentation Chart – Effective Market Analysis
#Business Introduction #Market and Competitor Analysis #Graph
-

Cumulative Results Over Four Years – Market Trends and Strategy
#Business Introduction #Market and Competitor Analysis #Graph
