
Building Presentation Template – Intuitive Cityscape Design
J0800005
- Last Update 01/10/2025
- File Size 37.6MB
- # of Slides 20
- File Format PPTX
- Slide Ratio 16:9
- Color
Slide Preview


Keywords
About the Product
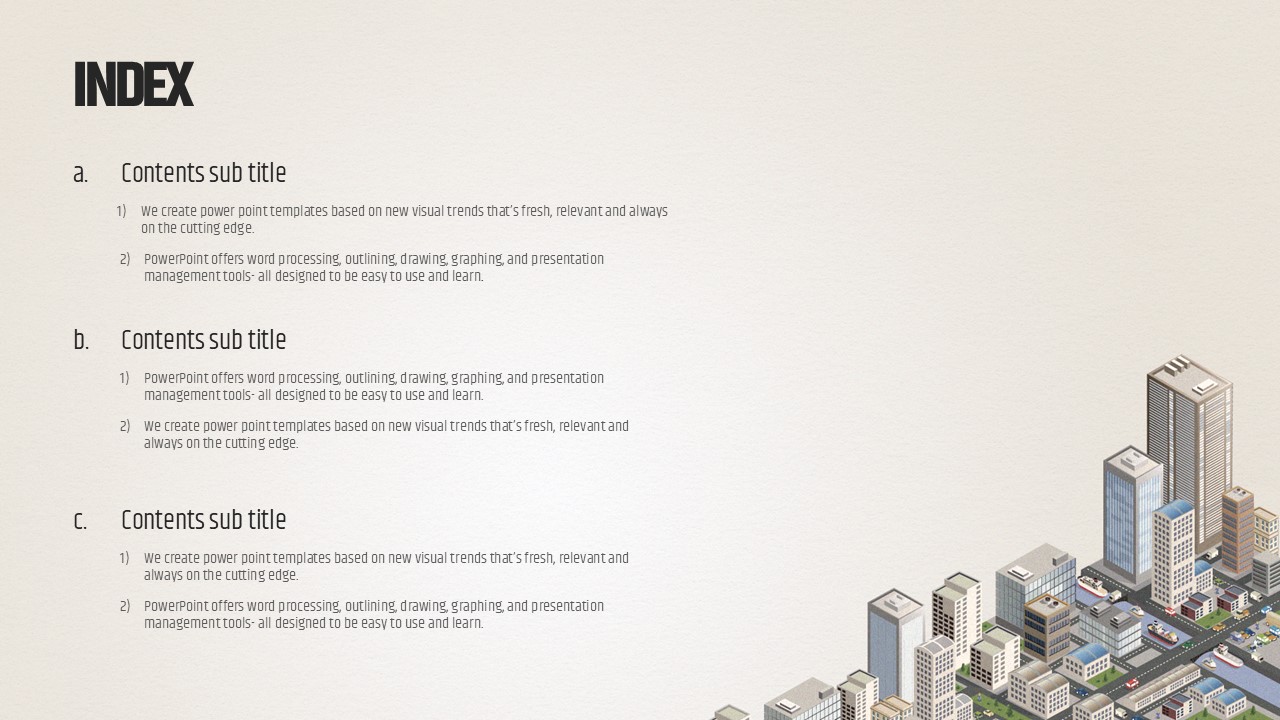
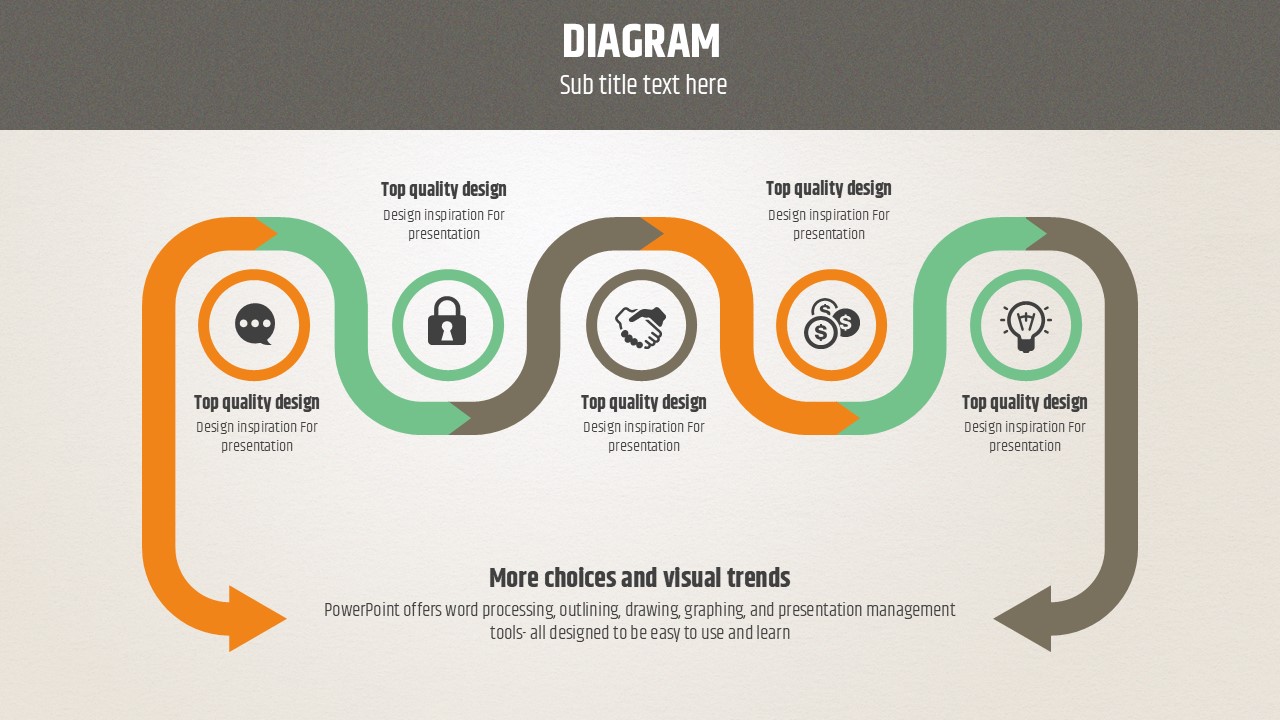
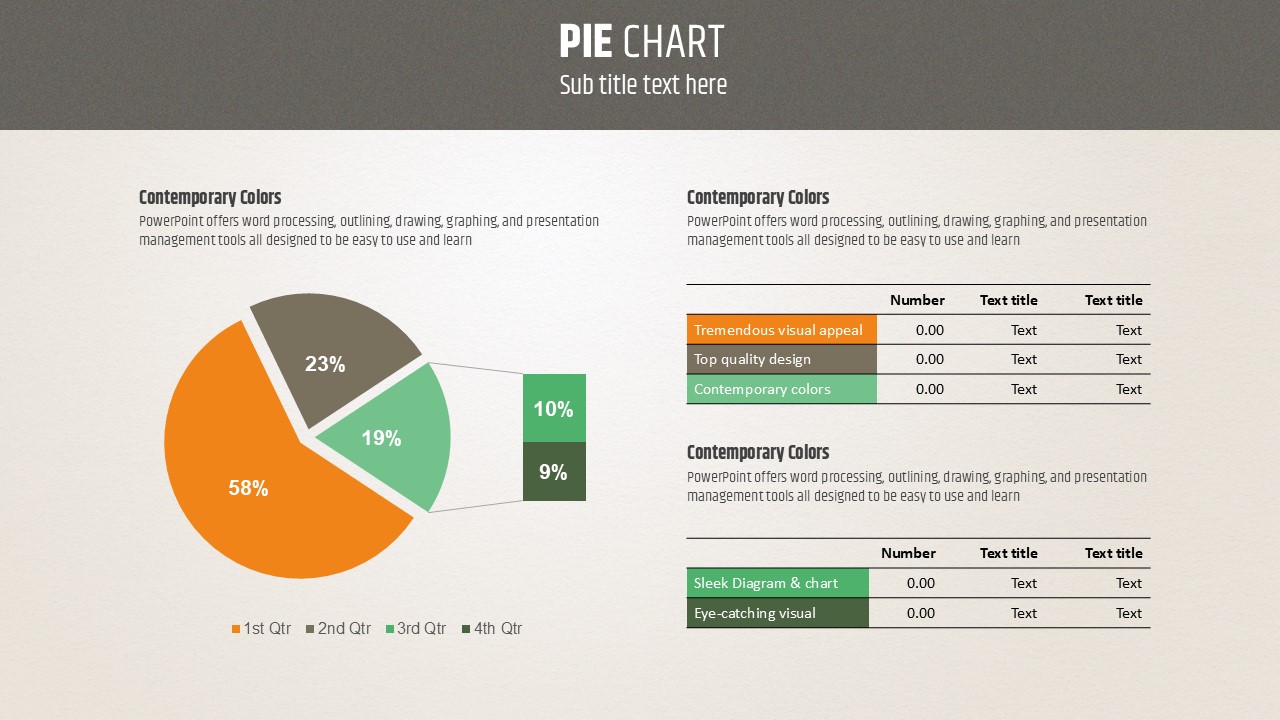
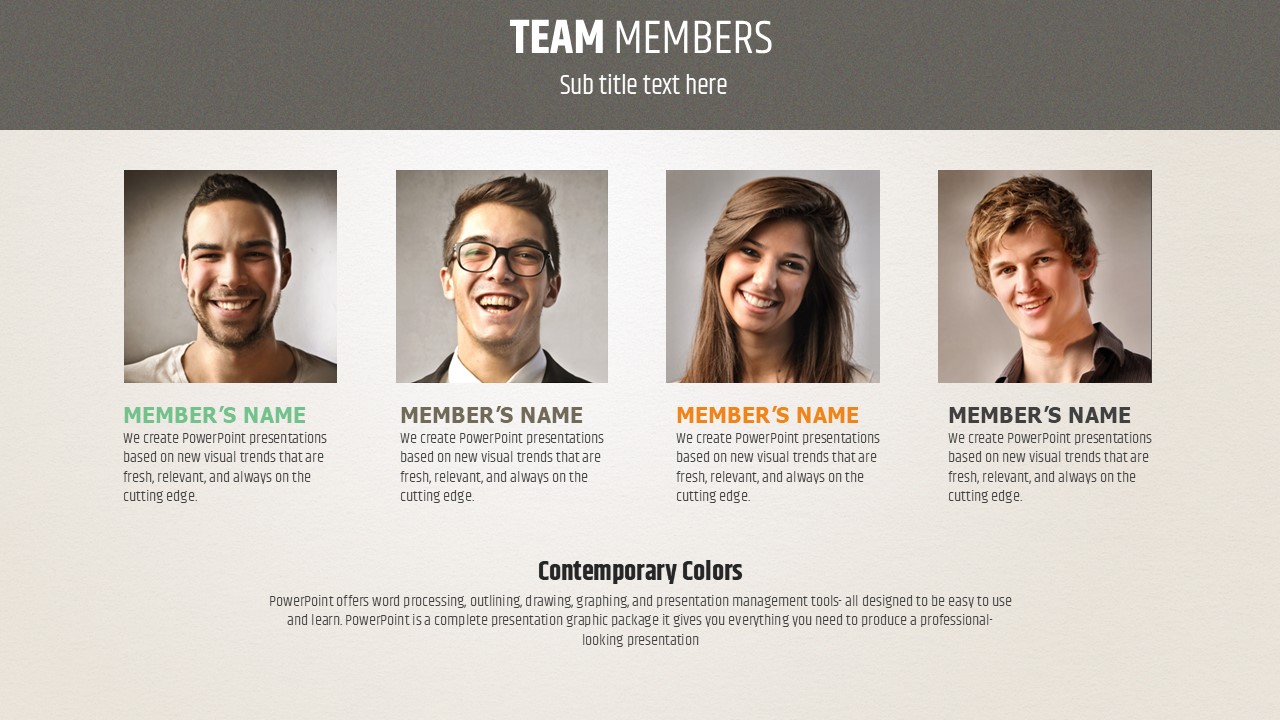
This PowerPoint template is purpose-built for construction companies, real estate developers, and urban planning agencies. The standout visual is a detailed isometric 3D cityscape illustration set against a warm cream-beige background, accented with orange and green highlights on a charcoal-gray header bar. The result is a cohesive, city-development atmosphere that runs consistently across all 20 slides. The balanced four-panel grid layout lets you present text, diagrams, and imagery side by side without sacrificing clarity. Slide types include a title slide with the full skyline illustration, three-column text layouts, a circular flow diagram, a four-person team member profile slide, and a horizontal timeline with circular percentage gauges. All slides are fully editable in PPTX format—swap in your own text, data, and brand colors in minutes. Ideal for construction IR decks, real estate development pitches, urban regeneration proposals, and infrastructure project reports.
Usage Points
-
Main Usage
Designed for construction firms, real estate developers, and urban planners who need a visually distinctive slide deck for IR pitches, project proposals, site development reports, and infrastructure presentations.
-
How to Use
Download the PPTX file and open it directly in PowerPoint. Replace placeholder text, statistics, and images with your own project data. Swap the orange and green accent colors for your company's brand palette to create a fully customized presentation in minutes.
-
Recommended For
Recommended for planning teams at construction companies, real estate investment managers, urban design consultants, architecture studios, and anyone who regularly prepares city-development or infrastructure pitch decks.
-
Slide Structure
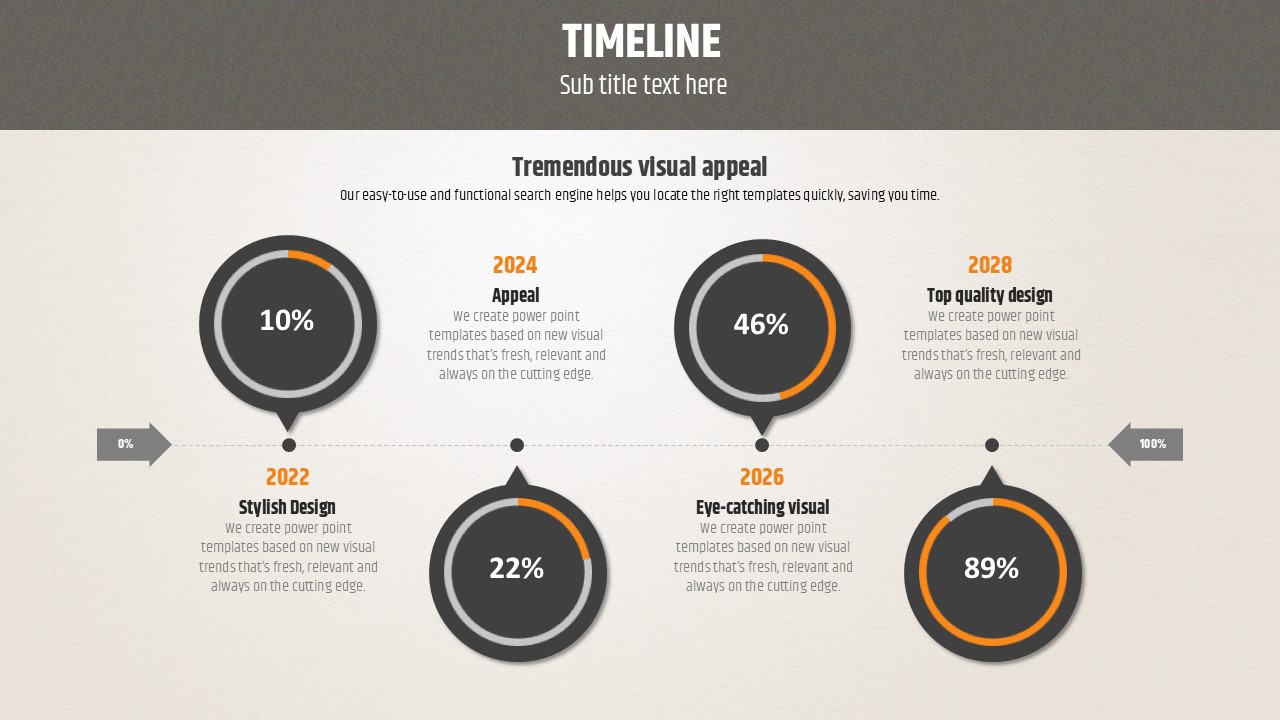
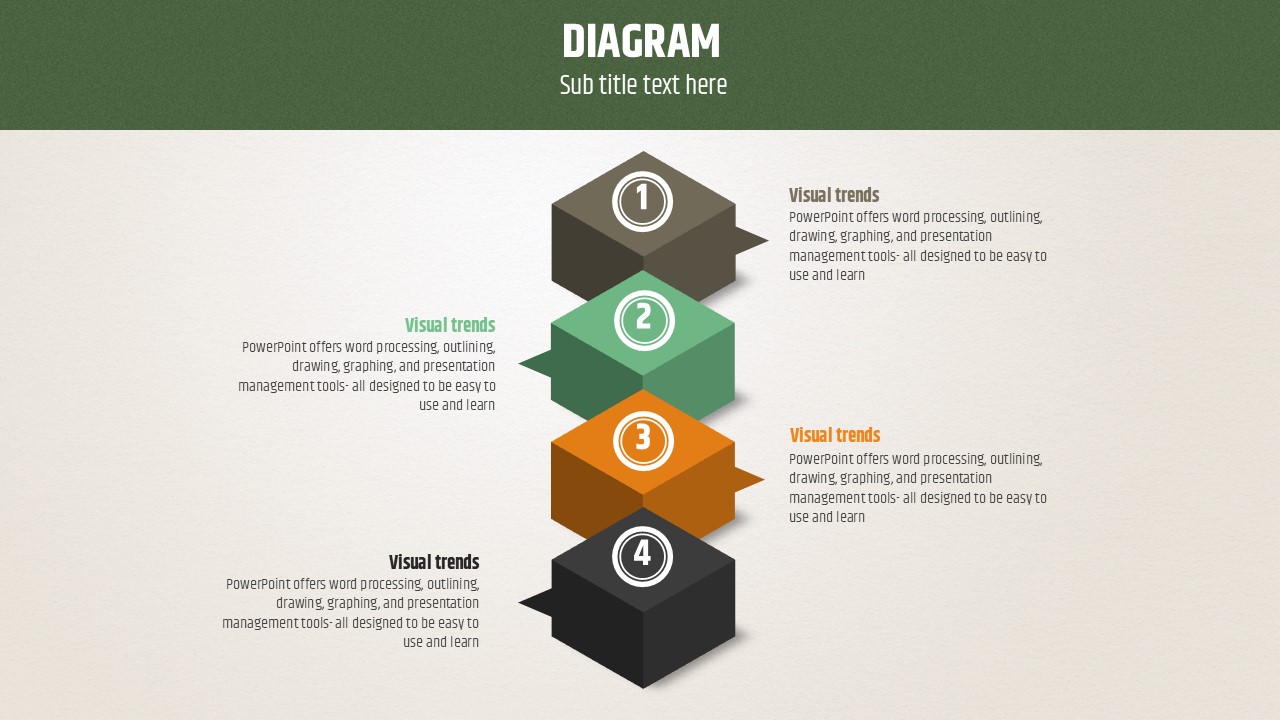
20 slides including: a title slide with isometric 3D skyline, three-column text layout, circular flow diagram with orange-green nodes, four-person team member profile grid, and a horizontal milestone timeline with circular percentage gauges.


