World Map for Location Data Analysis – Global Network Visualization
RJ0800005_19
- Last Update 08/01/2025
- File Size 11.8MB
- # of Slides 2
- File Format PPTX
- Slide Ratio 16:9
- Color
Keywords
About the Product
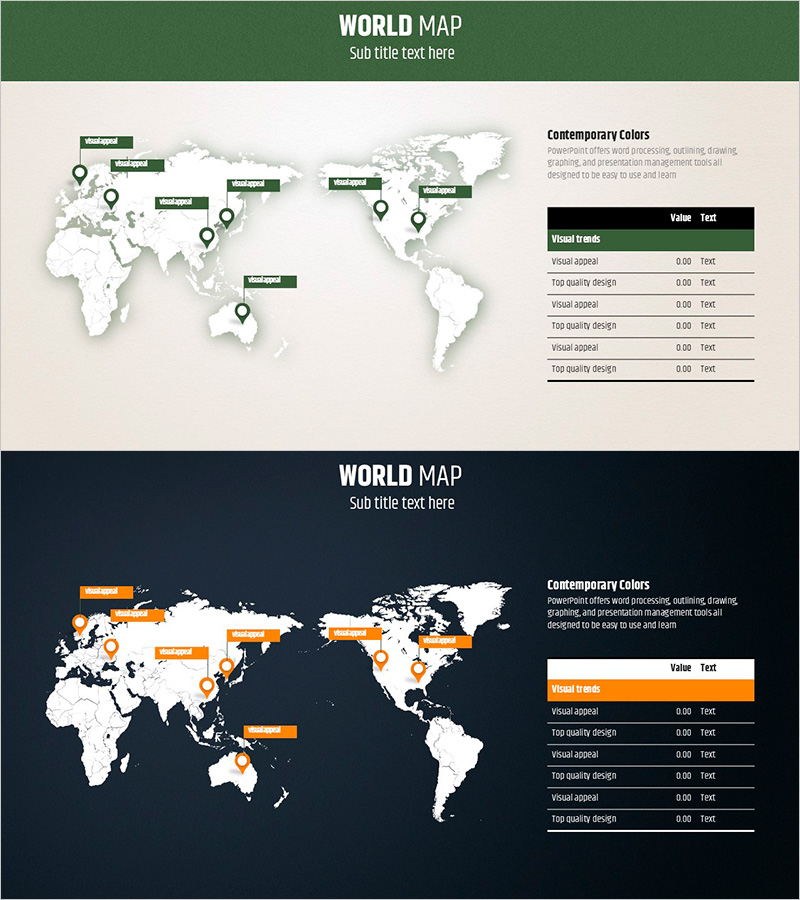
A 2-slide PowerPoint set for visualizing global networks and location-based data through world map visualization. Features a minimalist green-background layout and a dark background with orange accent version, each equipped with pin markers and label areas to clearly represent regional information. A data table positioned on the right side enables simultaneous presentation of numerical data and geographic visualization. Designed for immediate use in international business presentations, market analysis, global strategy planning, and cross-border partnership discussions.
Usage Points
-
Main Usage
Visualizes international market conditions, global network distribution, and regional business status through map-based representation to establish decision-making credibility. Pin markers highlight key business hubs while the right-side table provides quantitative data, enabling persuasive global strategy presentations.
-
How to Use
Edit pin marker positions and labels on each slide to indicate your company's business locations. Input regional sales figures, customer counts, market share percentages, and other key metrics into the right-side table to build data-driven presentations. Select either the green or orange version to match your corporate brand identity.
-
Recommended For
International business managers, marketing strategy teams, investor relations professionals, and global expansion planning departments. Ideal for overseas branch reporting, international market analysis, global partnership proposals, multinational project status updates, and all international collaboration presentations.
-
Slide Structure
Slide 1: Green header + beige background + world map + 8 pin markers + right-side data table (6 rows). Slide 2: Dark background + orange accent header + world map + 8 pin markers + right-side data table (6 rows). Both layouts include 2 text input areas (title and subtitle) + 8 marker labels + 12 table cells for flexible data entry.
Related Products
-

Country-by-Country Revenue Analysis Table – Data-Driven Insights
#Company Introduction #Market and Competitor Analysis #Diagram
-

Target Market Analysis Table
#Company Introduction #Market and Competitor Analysis #Diagram
-

Global Network Affiliation Status – Market Trend Analysis
#Company Introduction #Market and Competitor Analysis #Diagram
-

Setting a Target Country Strategy – Insights for Global Markets
#Company Introduction #Marketing Plan and Strategy #Diagram
