Sales Trend by Division – Performance Insights
RJ0800005_12
- Last Update 08/01/2025
- File Size 12.9MB
- # of Slides 2
- File Format PPTX
- Slide Ratio 16:9
- Color
Keywords
- #Content-Based Slides
- #Design-Based Slides
- #Market and Competitor Analysis
- #Financial Plans and Performance
- #Graph
- #Competitive Advantage
- #Sales and Revenue
- #Line
- #Line Chart
- #16:9
- #line chart PowerPoint
- #sales trend slide template
- #multi-series chart
- #time-series data visualization
- #financial performance PPT
About the Product
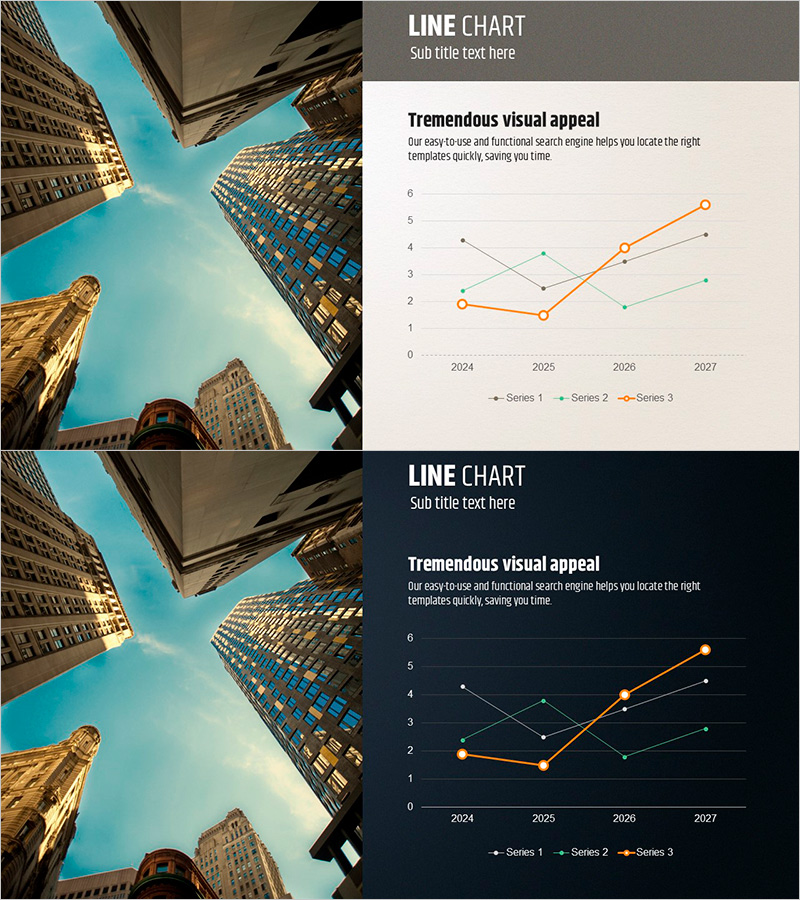
A multi-series line chart PowerPoint slide designed to visualize sales trends across business divisions from 2024 to 2027. The slide features three data series represented in orange, gray, and green, allowing clear comparison of performance trajectories over a four-year period. Two design versions are provided: a light beige background with urban architecture imagery for print and document distribution, and a dark navy background optimized for large-screen presentations. Ideal for financial reports, business performance reviews, investor presentations, and strategic planning sessions where time-series data analysis is essential.
Usage Points
-
Main Usage
Designed to compare sales trends across multiple business divisions or product lines over time. The three-series format enables simultaneous visualization of performance trajectories, making it easy to identify growth patterns, market shifts, and competitive positioning. Perfect for quarterly earnings reports, annual business reviews, investor relations presentations, and strategic performance analysis.
-
How to Use
Simply replace the X-axis values (years) and Y-axis values (sales figures) with your own data. The color scheme and line styles can remain as designed or be customized to match your corporate brand guidelines. Use the light background version for printed documents and distribution, and the dark background version for projection on large screens during live presentations.
-
Recommended For
Finance teams, executive leadership, marketing departments, and sales teams presenting quarterly or annual performance metrics. Particularly effective for divisional revenue comparisons, product line sales analysis, regional performance tracking, and multi-category trend analysis. Suitable for investor briefings, shareholder meetings, board presentations, and executive strategy sessions.
-
Slide Structure
Two-slide set with identical chart structure in different color schemes. The first slide features a light beige background with urban skyline photography and a three-series line chart. The second slide applies the same chart layout on a dark navy background for presentation flexibility. Each chart contains four X-axis data points (2024-2027) and three data series (Series 1, 2, 3) with legend and gridlines for easy data interpretation.
Related Products
-

Competitor Market Analysis Graph – Financial Performance and Competitive Advantage
#Market and Competitor Analysis #Financial Plans and Performance #Diagram
-

Line Graph Analysis of Textile Market – Gain Competitive Edge
#Market and Competitor Analysis #Financial Plans and Performance #Graph
-

Graph Analysis by Year Sales
#Market and Competitor Analysis #Financial Plans and Performance #Graph
-

Chair Sales Graph – Visual Data Analysis
#Market and Competitor Analysis #Financial Plans and Performance #Graph
