Market Analysis Report Visualized with Pie Chart
RJ0800005_9
- Last Update 08/01/2025
- File Size 11.4MB
- # of Slides 2
- File Format PPTX
- Slide Ratio 16:9
- Color
Keywords
- #Content-Based Slides
- #Design-Based Slides
- #Market and Competitor Analysis
- #Diagram
- #Graph
- #Market Share
- #Market Analysis
- #Table
- #Circles
- #Standard Table
- #Pie Chart
- #16:9
- #pie chart PowerPoint slide
- #4-segment pie graph template
- #market analysis chart presentation
- #data visualization slides
- #proportion comparison PowerPoint
- #business report graphics
About the Product
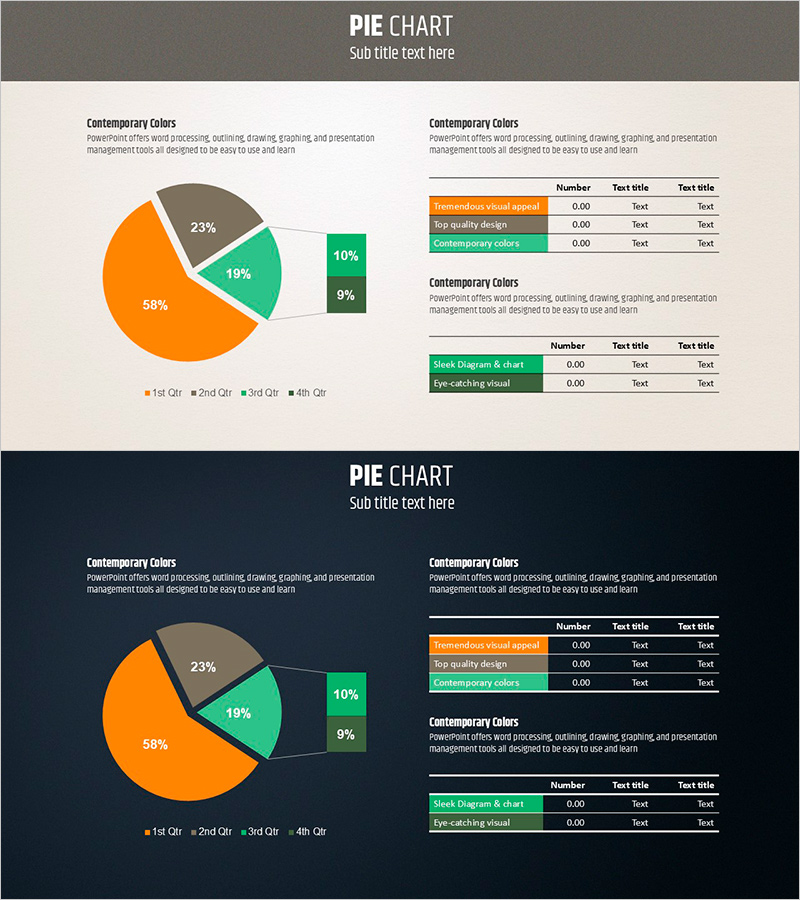
A professional pie chart PowerPoint slide designed to visualize market analysis data across four segments. The circular graph displays proportions of 58% (orange), 19% (green), 23% (gray), and 10% (green), making it ideal for presenting market share, customer segmentation, revenue composition, and budget allocation. This 2-slide deck includes both a light beige background version and a dark navy background version, each featuring a legend, editable data input table, and descriptive text area for immediate customization. Delivered in 16:9 widescreen PPTX format, fully compatible with all presentation platforms and ready for instant data entry and delivery.
Usage Points
-
Main Usage
Effectively communicates market share, customer segmentation, revenue breakdown, and cost allocation by displaying each component's proportion relative to the whole. The intuitive circular visualization enables audiences to instantly grasp relative data sizes, while the 4-segment structure maintains appropriate complexity without overwhelming viewers, ensuring core messages resonate clearly.
-
How to Use
Input actual data into the legend text and numerical data table on each slide, and the pie chart automatically updates to reflect your values. Use the light background version for bright conference rooms and printed materials; select the dark background version for dimly lit auditoriums and online presentations. Colors and legends are fully editable, and the text area accommodates additional insights or analytical commentary as needed.
-
Recommended For
Marketing professionals, executives, consultants, data analysts, and business intelligence specialists benefit most from this template. Ideal for quarterly business reports, market research presentations, investor pitch decks, strategic planning meetings, and any scenario requiring persuasive quantitative analysis delivery to stakeholders.
-
Slide Structure
Two-slide layout featuring a 4-segment pie chart, legend (1st Qtr, 2nd Qtr, 3rd Qtr, 4th Qtr), editable data input table (Number, Test title columns), and descriptive text area on each slide. Light beige and dark navy background versions provided in 16:9 widescreen format with left-aligned chart and right-aligned table/description layout.
Related Products
-

Modern Blue Pie Chart Template – Market Share Analysis
#Market and Competitor Analysis #Diagram #Graph
-

Performance Analysis Pie Chart – Market Share Visualization
#Market and Competitor Analysis #Diagram #Graph
-

Creative Line PPT Pie Chart Analysis – Visualizing Market Share
#Market and Competitor Analysis #Graph #Market Share
-

Pie Chart and Table Metrics – Market Share Analysis
#Market and Competitor Analysis #Financial Plans and Performance #Diagram
