Progress Timeline – Visualization of Business Strategies
RJ0800005_11
- Last Update 08/01/2025
- File Size 11.4MB
- # of Slides 2
- File Format PPTX
- Slide Ratio 16:9
- Color
Keywords
- #Content-Based Slides
- #Design-Based Slides
- #Product/Service Introduction
- #Business Strategy
- #Diagram
- #Graph
- #Development Status
- #Achievements
- #Flow
- #Circles
- #Multidirectional Flow
- #Doughnut Chart
- #16:9
- #donut chart PowerPoint
- #circular chart slide template
- #progress timeline visualization
- #business strategy presentation
- #4-stage progress tracking slide
About the Product
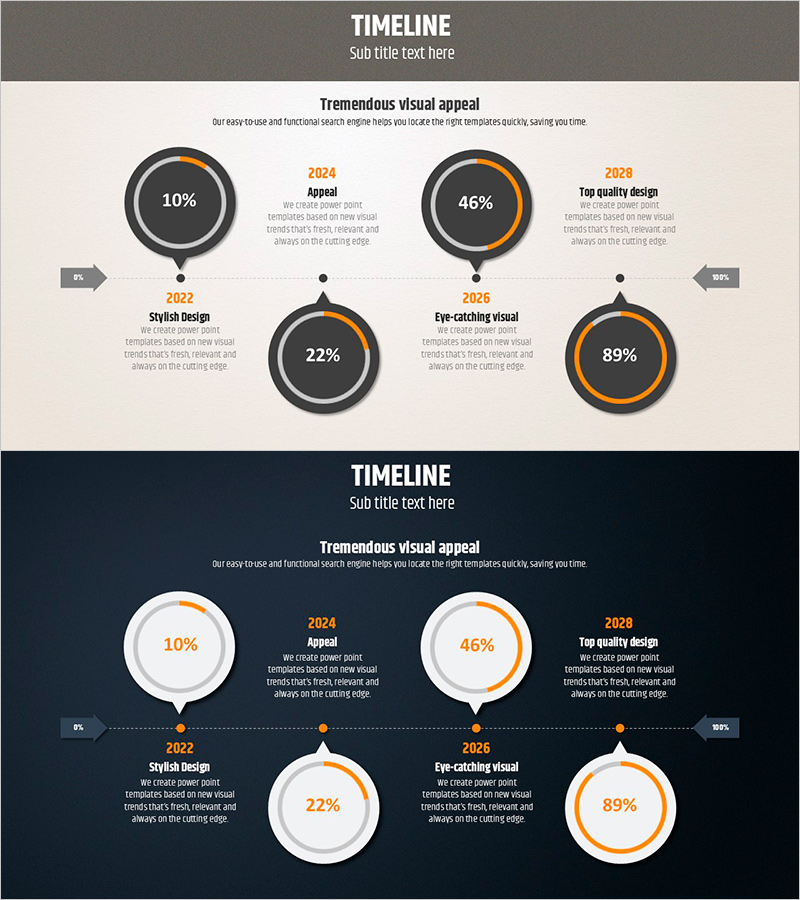
A donut chart timeline PowerPoint slide that visualizes business strategy progress with four stages of achievement metrics. This 2-slide presentation uses a gray background with orange accent colors to clearly display progress rates (10%, 22%, 46%, 89%) at each milestone. Central donut charts display percentages while timeline markers show years and key achievements, combining project timeline and performance data in one visual. Available in 16:9 widescreen PPTX format for immediate editing and customization in business reports, strategy presentations, and performance analysis materials.
Usage Points
-
Main Usage
Visualize project progress and stage-by-stage achievements using donut charts to clearly communicate business strategy status. Timeline markers combined with percentage displays enable audiences to understand progress over time at a glance.
-
How to Use
Use in executive reports, business strategy presentations, quarterly performance reviews, and project status updates when emphasizing progress rates at each stage. Edit the percentage values and year labels to match your actual project data and customize colors as needed.
-
Recommended For
Business planning teams, project managers, executive reporting staff, and strategy development departments requiring progress tracking and performance visualization. Particularly effective for internal meetings and investor presentations where stage-by-stage goal achievement must be highlighted.
-
Slide Structure
Two-slide layout with title area at top, four donut charts in center (displaying 10%, 22%, 46%, 89% respectively), and timeline markers with years (2022, 2024, 2025, 2028) and milestone text at bottom. Gray background with orange accent lines represents progress, while left-right arrows indicate timeline flow.
Related Products
-

Interior Preference Donut Chart – Data Visualization
#Product/Service Introduction #Business Strategy #Graph
-

Blue Green Progress Visualization – Graph for Achievement Rate
#Product/Service Introduction #Business Strategy #Market and Competitor Analysis
-

Core Exercise Donut Chart – Visualizing Performance and Development
#Product/Service Introduction #Business Strategy #Graph
-

Eco-farming Agriculture Expected Return on Investment Analysis – Design and Data Visualization
#Product/Service Introduction #Business Strategy #Graph
